Fig. C.1.
Download original image
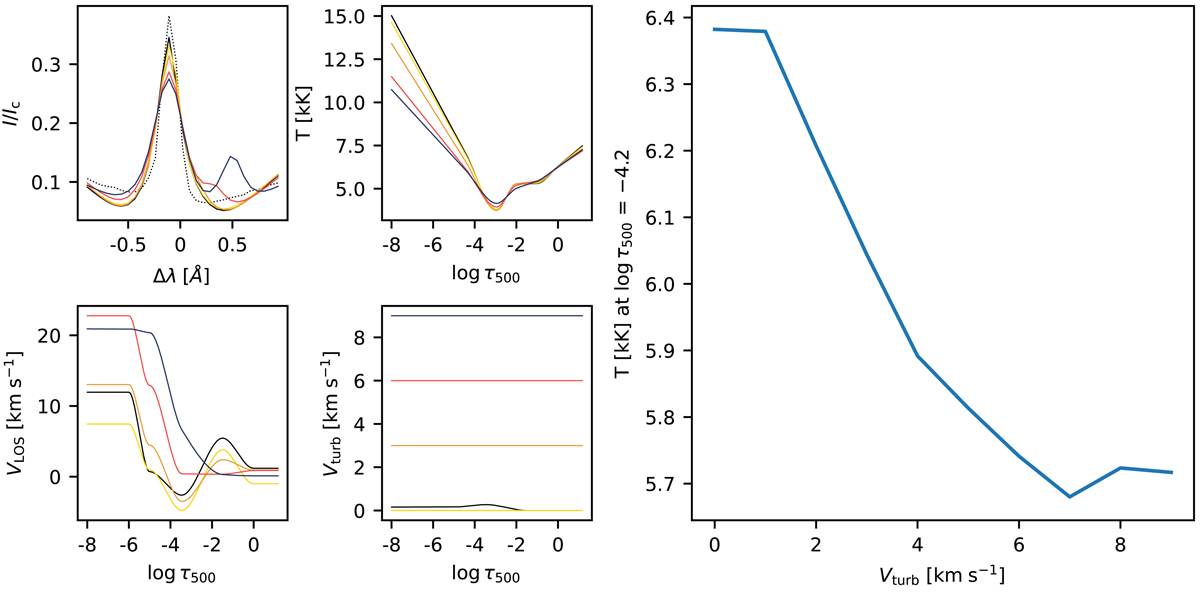
Understanding the relationship between T and Vturb. The top left panel shows the quality of fits to the Ca II K profile, while the panel to the right shows the T stratification. The bottom left panel shows the VLOS stratification and the panel to the right shows the value of the Vturb used to invert the selected profile. The large panel on the right shows the T at log τ500 =−4.2 as a function of Vturb. The observed (dashed) and fitted (solid) Ca II K profile (the Ca II K profile shown in right panel of Fig. B.2 at t = 57.8 s) is shown in black. The T, VLOS, and Vturb stratification inferred using inversions (main text, Vturb≃0) are also shown in black. The yellow, orange, red, and blue colors represent the experiments for the Vturb values 0, 3, 6, and 9 km s−1, respectively.
Current usage metrics show cumulative count of Article Views (full-text article views including HTML views, PDF and ePub downloads, according to the available data) and Abstracts Views on Vision4Press platform.
Data correspond to usage on the plateform after 2015. The current usage metrics is available 48-96 hours after online publication and is updated daily on week days.
Initial download of the metrics may take a while.