Fig. B.1.
Download original image
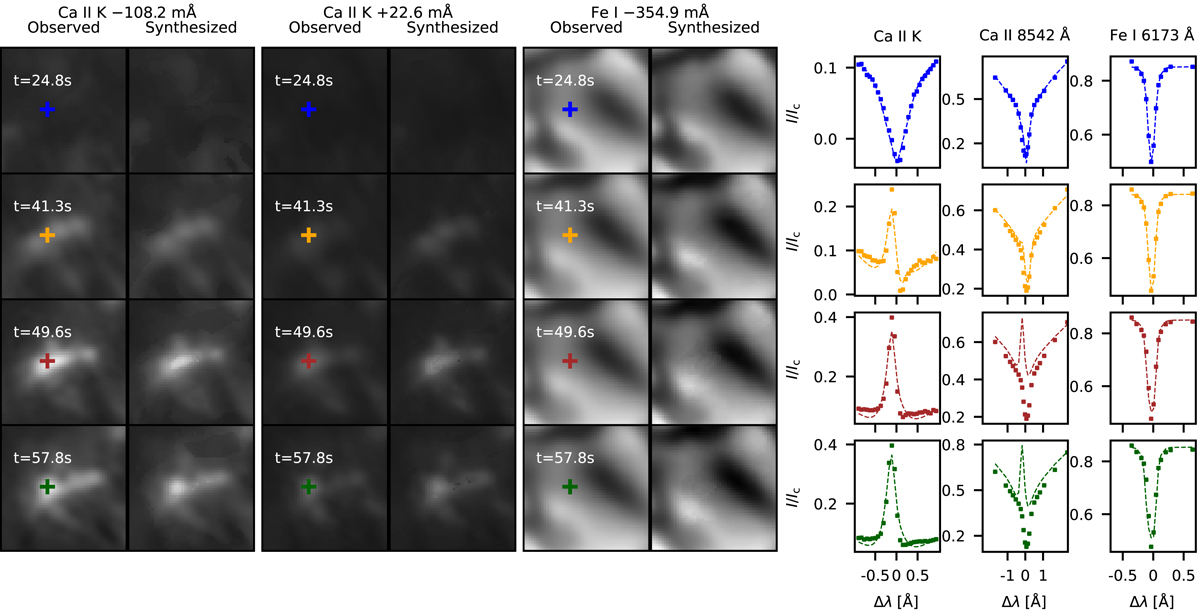
Illustrating the quality of fits of synthesized narrowband images and spectral profiles inferred using inversions for ROI A. Comparison of fits synthesized with observed narrowband images at wavelength offsets of −108.2 mÅand +22.6 mÅfrom the Ca II K line core, and −354.9 mÅ from the Fe I 6173 Å line core at different times. A gamma correction was applied with γ = 0.7 on both the observed and synthesized Ca II K narrowband images before display. The right panel shows the evolution of the observed (dotted) and synthesized (dashed) profiles of a pixel that appear brightest at t = 49.6 s in the narrowband images at the wavelength offset of −108.2 mÅfrom the Ca II K line core. The Ca II 8542 Å and the Fe I 6173 Å spectral cubes were acquired 27 s before the Ca II K cube.
Current usage metrics show cumulative count of Article Views (full-text article views including HTML views, PDF and ePub downloads, according to the available data) and Abstracts Views on Vision4Press platform.
Data correspond to usage on the plateform after 2015. The current usage metrics is available 48-96 hours after online publication and is updated daily on week days.
Initial download of the metrics may take a while.