Open Access
Fig. A.1.
Download original image
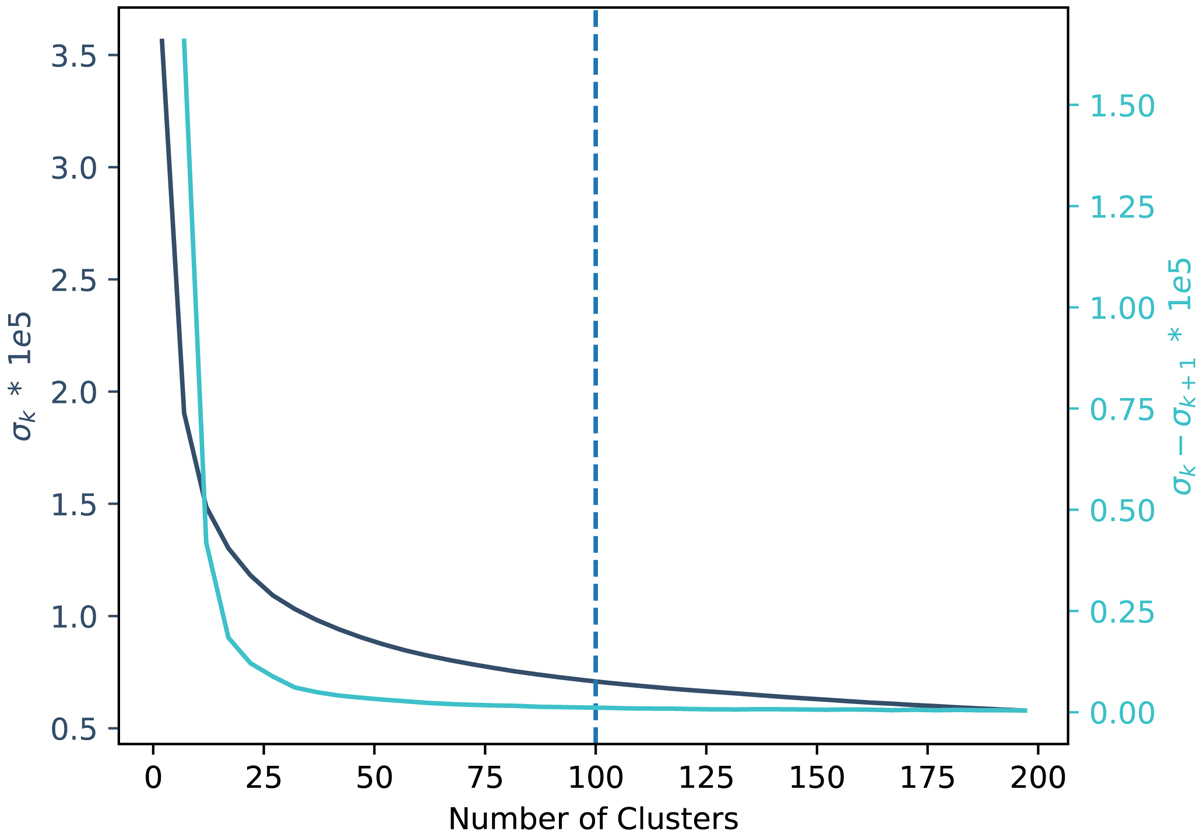
Finding the optimum number of clusters k for the k-means clustering of Ca II K profiles. The dark blue curve denotes inertia (σk) for k clusters, whereas σk − σk + 1 is represented by the cyan curve. The vertical dashed line indicates the used number of clusters k = 100.
Current usage metrics show cumulative count of Article Views (full-text article views including HTML views, PDF and ePub downloads, according to the available data) and Abstracts Views on Vision4Press platform.
Data correspond to usage on the plateform after 2015. The current usage metrics is available 48-96 hours after online publication and is updated daily on week days.
Initial download of the metrics may take a while.