Fig. 11.
Download original image
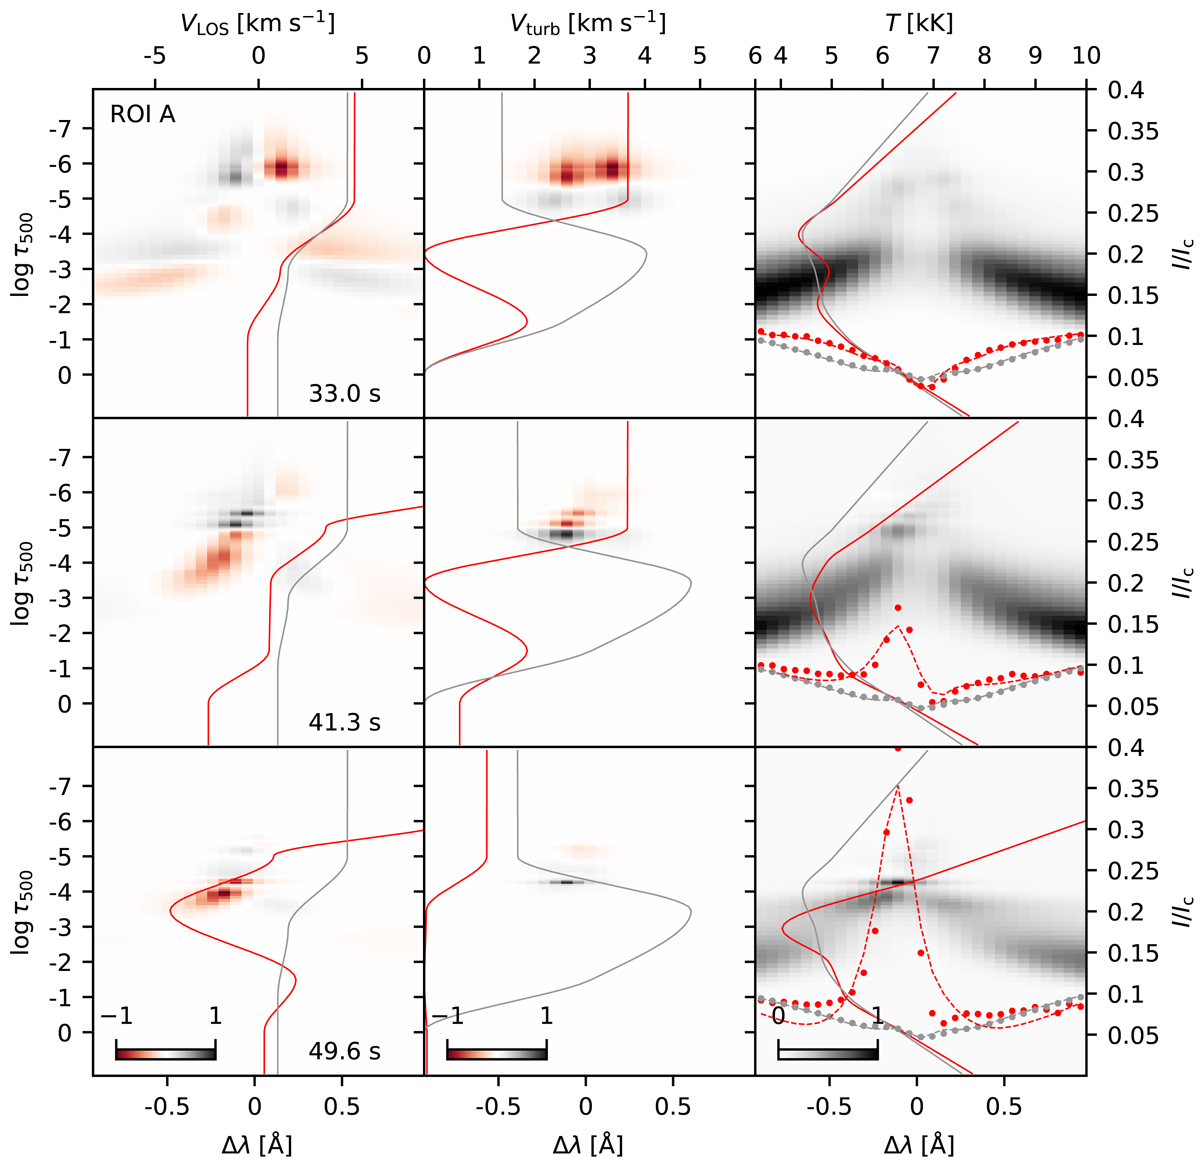
Normalized response functions of the Ca II K line to the perturbations of VLOS (the left column), Vturb (the middle column), and T (the right column) for the marked pixel in Fig. 2a at three time steps, namely t = 33.0 s (quiescent phase, the first row), t = 41.3 s (intermediate CBG phase, the second row), and t = 49.6 s (when the CBG is at its maximum brightness, the third row). The inferred atmospheric quantities are shown with a solid red curve and the median profile over the entire FOV is shown in gray for comparison. The observed intensities are shown with red (CBGs) and gray (median profile) filled circles in the right column, and the fitted line profiles are shown with dashed curves. A gamma correction with γ = 0.5 was applied on the T response function before display.
Current usage metrics show cumulative count of Article Views (full-text article views including HTML views, PDF and ePub downloads, according to the available data) and Abstracts Views on Vision4Press platform.
Data correspond to usage on the plateform after 2015. The current usage metrics is available 48-96 hours after online publication and is updated daily on week days.
Initial download of the metrics may take a while.