Fig. 1.
Download original image
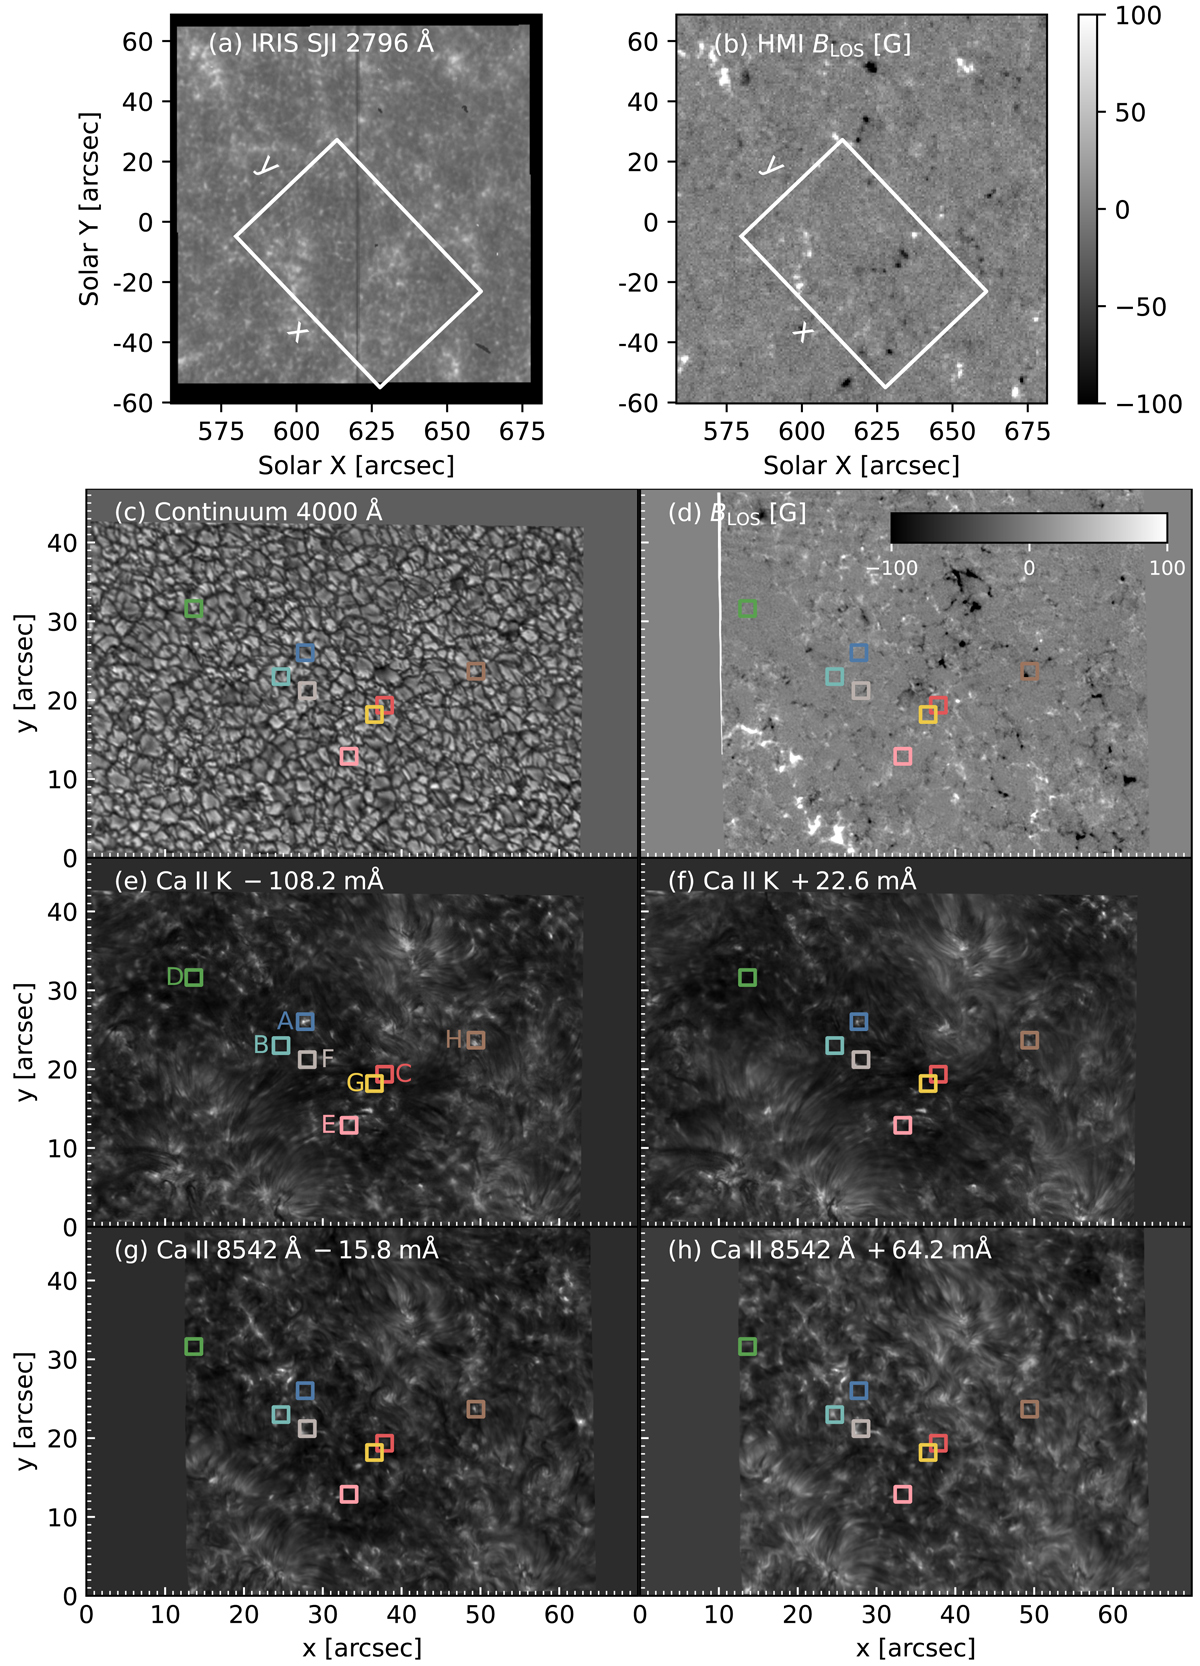
Overview of the quiet-Sun region observed on 6 June 2019. (a) Interface Region Imaging Spectrograph SJI at the Mg II k 2796 Å. (b) Solar Dynamics Observatory/Helioseismic and Magnetic Imager LOS magnetogram. The white boxes in panels a and b mark the spatial location of the FOV observed with the CHROMIS instrument. (c) Continuum image at 4000 Å. (d) Line-of-sight magnetic field inferred using Milne-Eddington inversions of the Fe I 6173 Å line observed with the CRISP instrument. Panels e and f show images at wavelength offsets of −108.2 and +22.6 mÅ from the Ca II K line core, respectively. Panels g and h display images at wavelength offsets of −15.8 and +64.2 mÅ from the Ca II 8542 Å line core, respectively. A gamma correction with γ = 1.5 and γ = 0.5 was applied on panels a and e–h, respectively. The ROI s (A–H) highlighted by colored squares of 50 × 50 pixels (![]() 1
1![]() 85) indicate the locations of the Ca II K grains that are analyzed in this paper. Region of interest A shows a CBG in Ca II K narrowband images (panels e and f), the brightenings in other ROI s occurred at different times.
85) indicate the locations of the Ca II K grains that are analyzed in this paper. Region of interest A shows a CBG in Ca II K narrowband images (panels e and f), the brightenings in other ROI s occurred at different times.
Current usage metrics show cumulative count of Article Views (full-text article views including HTML views, PDF and ePub downloads, according to the available data) and Abstracts Views on Vision4Press platform.
Data correspond to usage on the plateform after 2015. The current usage metrics is available 48-96 hours after online publication and is updated daily on week days.
Initial download of the metrics may take a while.