Open Access
Fig. A.2.
Download original image
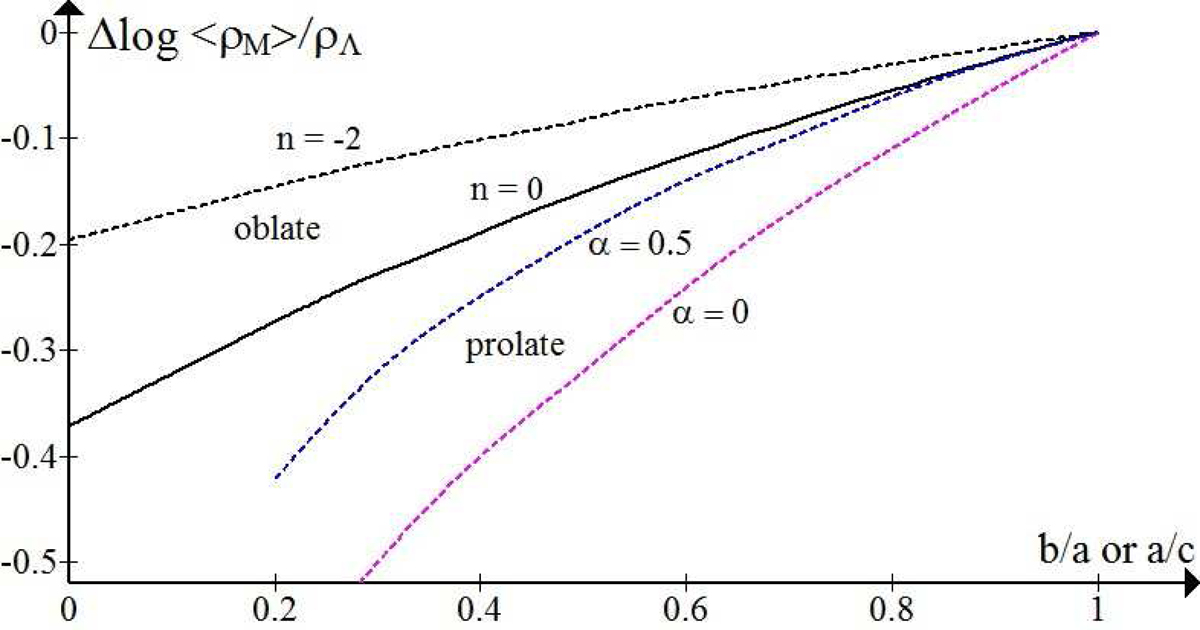
Shift of the ‘gravity = antigravity’ balance line in the Δlog⟨ρ⟩/ρΛ vs. log R diagram as a function of the axis ratio b/a (oblate) and a/c (prolate). For example, when a/c is greater than 0.5, the shift is less than about 0.3 for all the cases considered.
Current usage metrics show cumulative count of Article Views (full-text article views including HTML views, PDF and ePub downloads, according to the available data) and Abstracts Views on Vision4Press platform.
Data correspond to usage on the plateform after 2015. The current usage metrics is available 48-96 hours after online publication and is updated daily on week days.
Initial download of the metrics may take a while.