Fig. 6.
Download original image
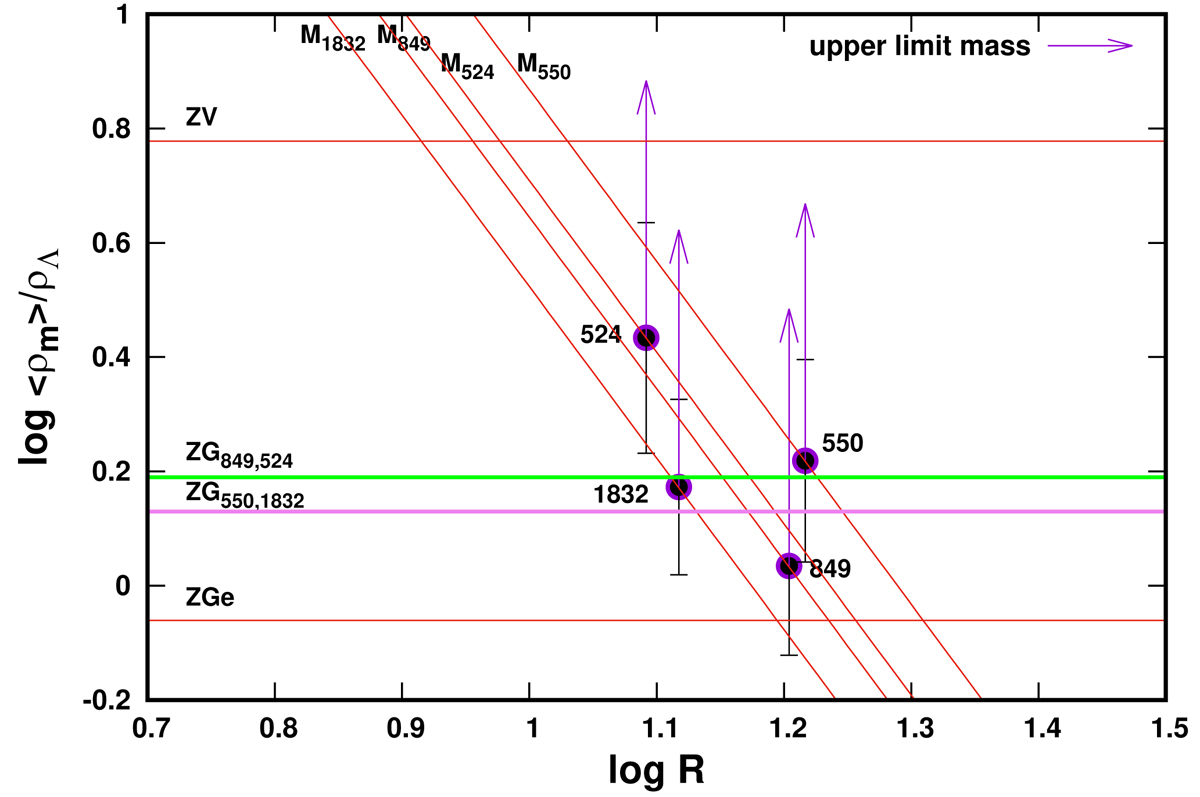
Λ significance diagram for four QS superclusters. The purple horizontal line shows the shape-corrected ZG balance line for QS 550 and QS 1832 and the green line shows the ZG value for QS 849 and QS 524. Inclined lines show the QS masses (see Table 2). Arrows show estimated upper limits for the QSs in the graph. The log(⟨ρM⟩/ρΛ) ZV line is shown as in Fig. 5. The ZGe shows the theoretical limit of the zero-gravity balance line for completely flat systems.
Current usage metrics show cumulative count of Article Views (full-text article views including HTML views, PDF and ePub downloads, according to the available data) and Abstracts Views on Vision4Press platform.
Data correspond to usage on the plateform after 2015. The current usage metrics is available 48-96 hours after online publication and is updated daily on week days.
Initial download of the metrics may take a while.