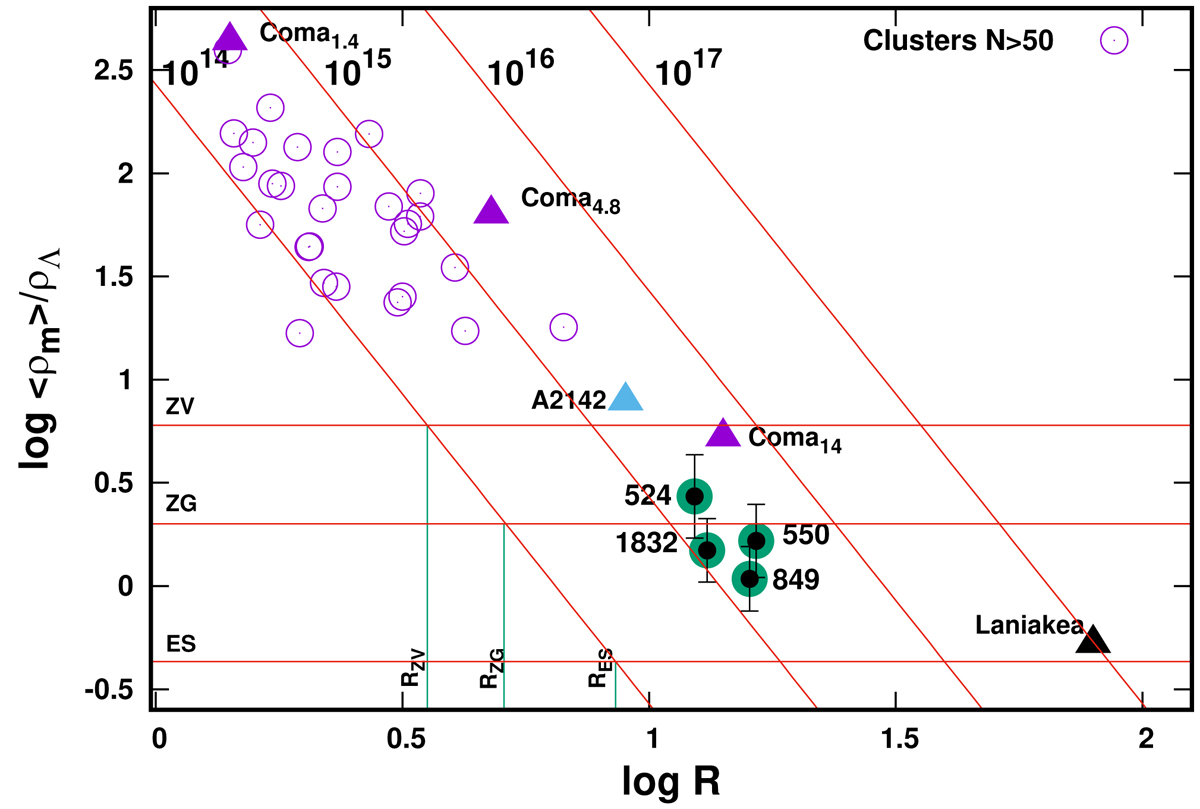
Fig. 5.
Download original image
Λ significance diagram for SDSS clusters of galaxies (purple) with QS superclusters marked in green. The Laniakea supercluster, the central regions of the supercluster A2142 and the Coma cluster with three different mass and size estimates are shown. Inclined lines show the effect of different example mass values. Green vertical lines show the values of the RZV (zero velocity radius), RZG (zero gravity radius), and the RES (the Einstein-Straus radius for the mass 1014 M⊙) and the horizontal lines show logarithmic values for the constant ratios of the ⟨ρM⟩/ρΛ = 6 (ZV), 2 (ZG), and 3/7 (ES).
Current usage metrics show cumulative count of Article Views (full-text article views including HTML views, PDF and ePub downloads, according to the available data) and Abstracts Views on Vision4Press platform.
Data correspond to usage on the plateform after 2015. The current usage metrics is available 48-96 hours after online publication and is updated daily on week days.
Initial download of the metrics may take a while.