Fig. 3.
Download original image
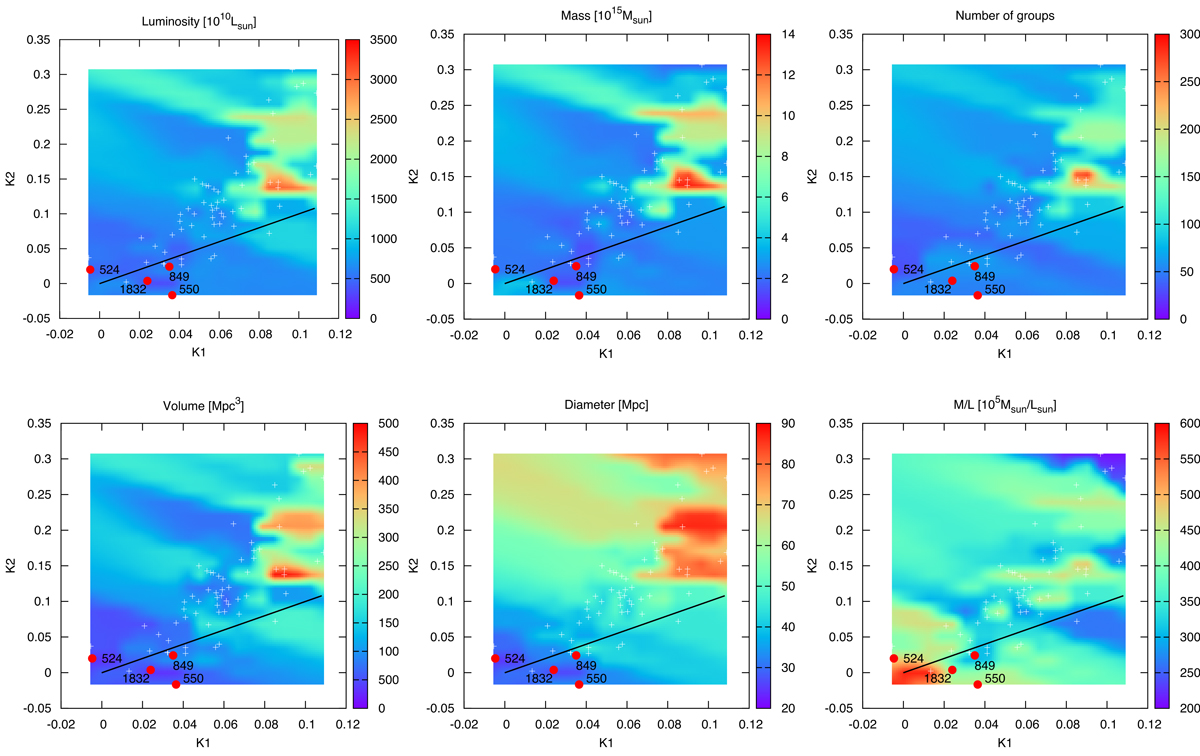
Coloured contours show the distribution of the values of supercluster properties in the K1 − K2 plane. Quasi-spherical superclusters K1, K2 < (0.05, 0.05) are shown with red points, white points are all the superclusters. Luminosities are in units of 1010 L⊙, masses in 1015 M⊙, volumes in Mpc3, and diameter in megaparsecs (Mpc). The dark line indicates K1 = K2 and divides the morphologies between pancakes and filaments.
Current usage metrics show cumulative count of Article Views (full-text article views including HTML views, PDF and ePub downloads, according to the available data) and Abstracts Views on Vision4Press platform.
Data correspond to usage on the plateform after 2015. The current usage metrics is available 48-96 hours after online publication and is updated daily on week days.
Initial download of the metrics may take a while.