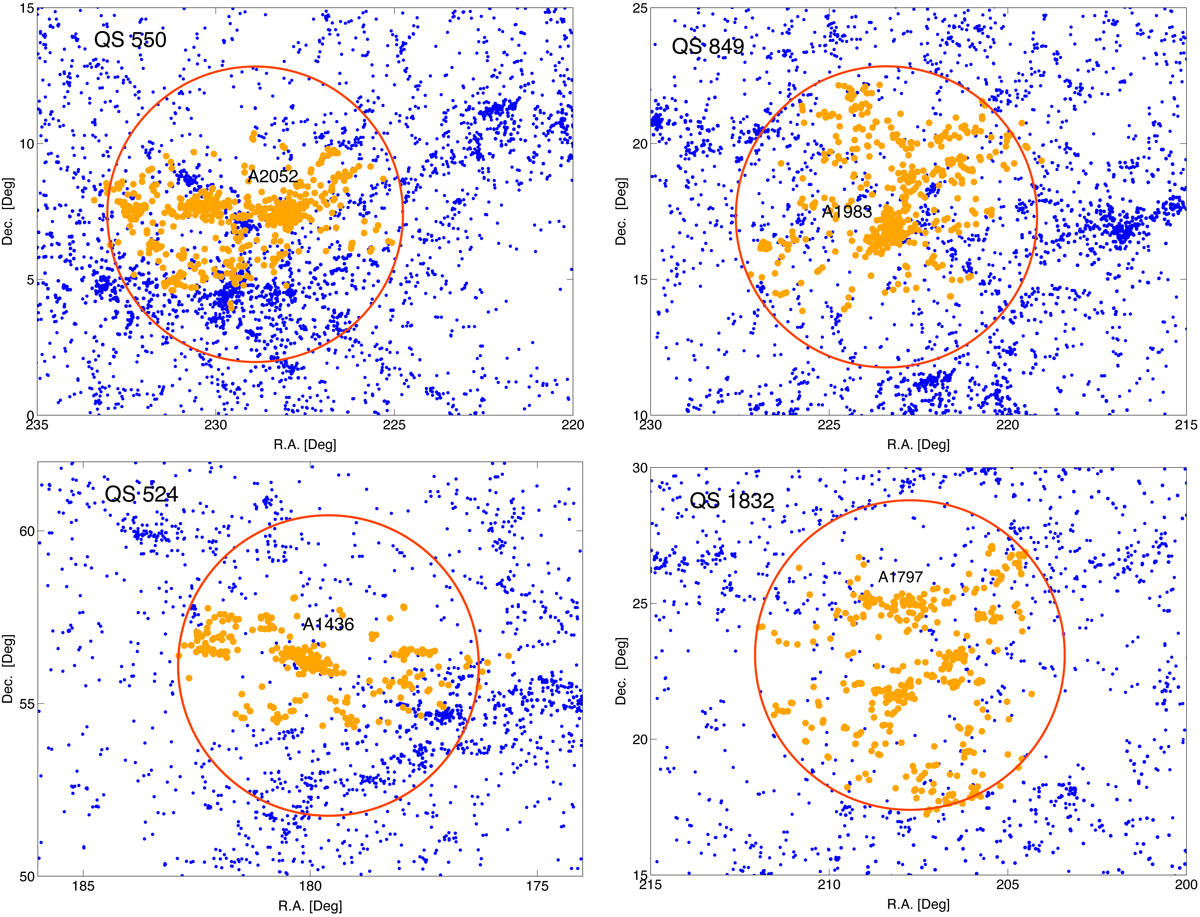
Fig. B.1.
Download original image
Distribution of galaxies in the regions of superclusters QS 550, QS 849, QS 524, and QS 1832 in the plane of the sky. Orange dots correspond to supercluster member galaxies and blue dots show the galaxies outside the superclusters. A red spherical circle illustrates the spherical diameter of a supercluster (see table 1). Abell clusters are labeled.
Current usage metrics show cumulative count of Article Views (full-text article views including HTML views, PDF and ePub downloads, according to the available data) and Abstracts Views on Vision4Press platform.
Data correspond to usage on the plateform after 2015. The current usage metrics is available 48-96 hours after online publication and is updated daily on week days.
Initial download of the metrics may take a while.