Fig. 4
Download original image
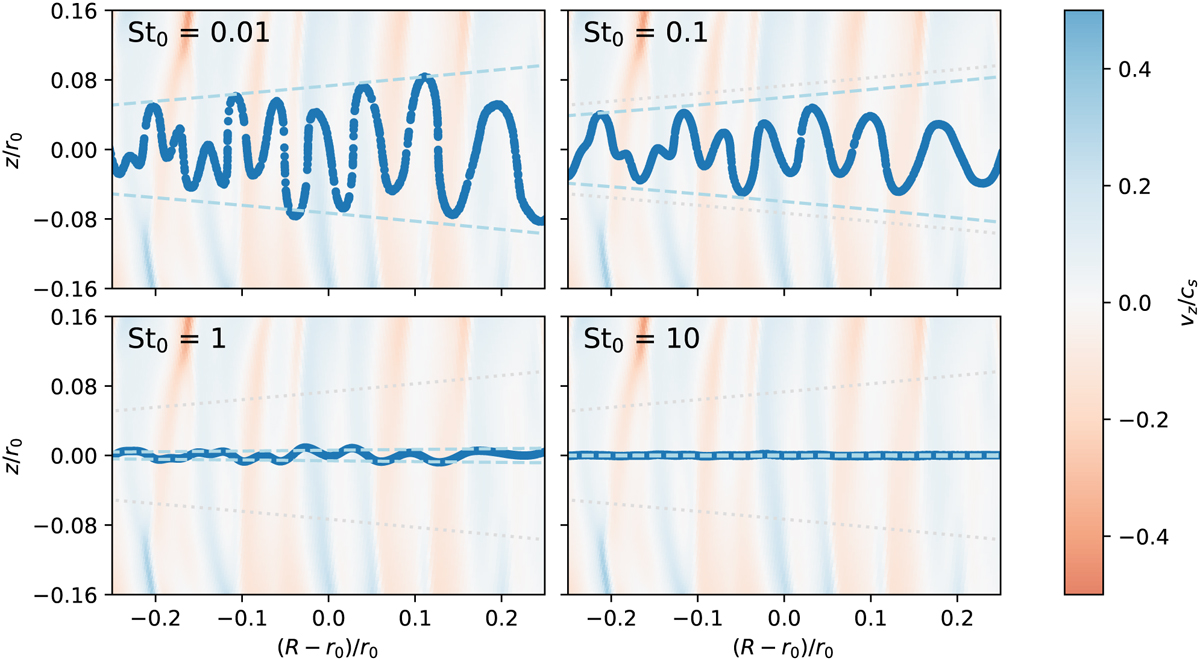
Snapshots of the location of the particles (blue dots) 2.5 orbits after they were inserted at the midplane into the fully developed VSI hydrodynamic model, for four values of St0. The coordinates are the cylindrical radius R in units of, and relative to, r0, and the cylindrical vertical height z above the midplane in units of r0. The background image shows the vertical gas velocity vz, where blue is upward and red is downward, in the same color scale as in Fig. 1. The gray dotted lines show the gas pressure scale height for comparison. The lightblue dashed lines are the conveyor-belt estimate of the maximum vertical height of the dust particles, Eq. (2) with an upper cap at z = hp (which is why the dashed and dotted lines overlap for St0 = 0.01).
Current usage metrics show cumulative count of Article Views (full-text article views including HTML views, PDF and ePub downloads, according to the available data) and Abstracts Views on Vision4Press platform.
Data correspond to usage on the plateform after 2015. The current usage metrics is available 48-96 hours after online publication and is updated daily on week days.
Initial download of the metrics may take a while.