Fig. C.1
Download original image
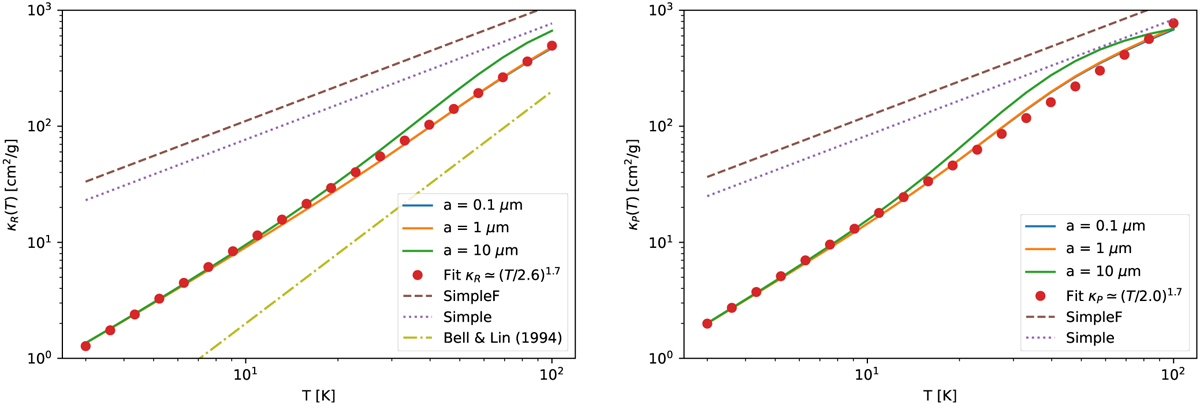
Small dust grain mean opacities as a function of temperature for three grain sizes. Left: Rosseland mean. Right: Planck mean. In the left panel the often-used opacity of Bell & Lin (1994) is plotted for comparison, which is used by Lin & Youdin (2015), Pfeil & Klahr (2019) and many other works. Malygin et al. (2017) use the dust opacity model of Semenov et al. (2003), which is, however, very similar to that of Bell & Lin (1994) in this temperature range. Also for comparison, the top two curves in each panel show the mean opacity for the simple κλ = 3π/2ρsλ small-grain opacity model used by Fukuhara et al. (2021), for our value of the material density ρs = 1.48 g cm−3 (Simple) and their value of ρs = 1.00 g cm−3 (SimpleF).
Current usage metrics show cumulative count of Article Views (full-text article views including HTML views, PDF and ePub downloads, according to the available data) and Abstracts Views on Vision4Press platform.
Data correspond to usage on the plateform after 2015. The current usage metrics is available 48-96 hours after online publication and is updated daily on week days.
Initial download of the metrics may take a while.