Fig. 8.
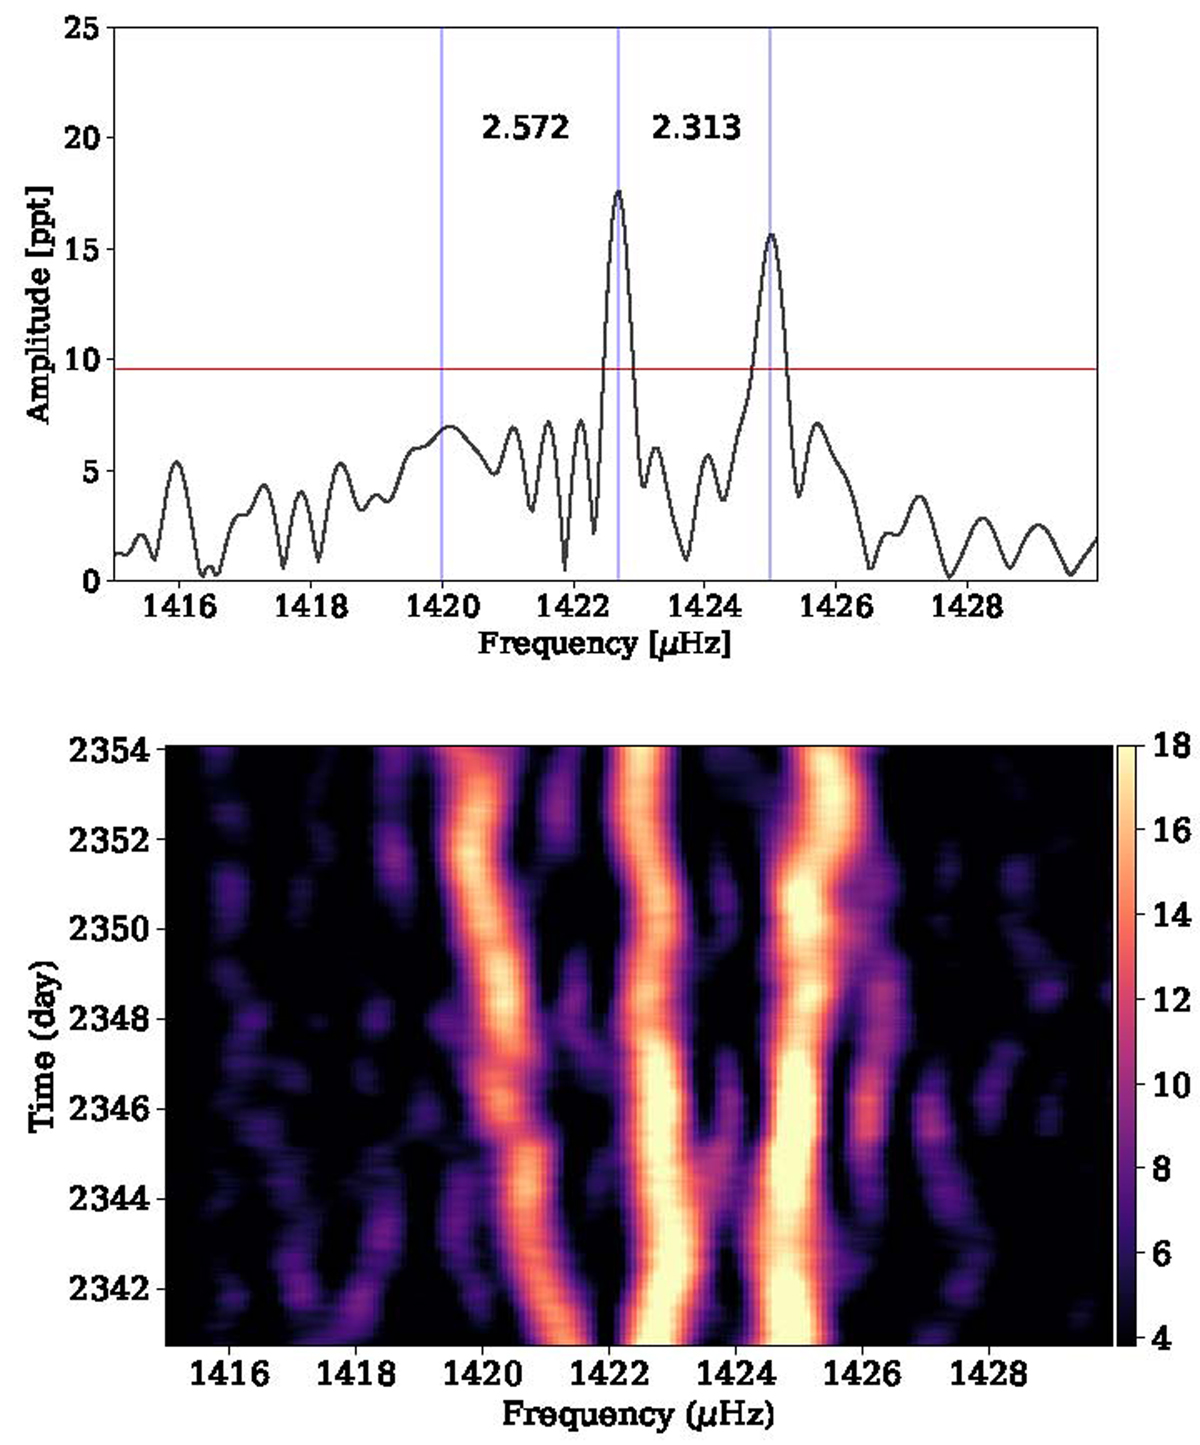
Download original image
Detected rotational triplet in WDJ152738.4-450207.4. Top panel: Fourier transform of data taken in sector 38. The horizontal red line presents the 0.1% FAP level. We indicated the azimuthal orders (vertical blue lines) of dipole modes and the rotational splitting. Bottom panel: Depicts the Sliding Fourier Transform of the same sector covering the same frequency region. The color-scale shows amplitude in ppt units.
Current usage metrics show cumulative count of Article Views (full-text article views including HTML views, PDF and ePub downloads, according to the available data) and Abstracts Views on Vision4Press platform.
Data correspond to usage on the plateform after 2015. The current usage metrics is available 48-96 hours after online publication and is updated daily on week days.
Initial download of the metrics may take a while.