Open Access
Fig. 3.
Download original image
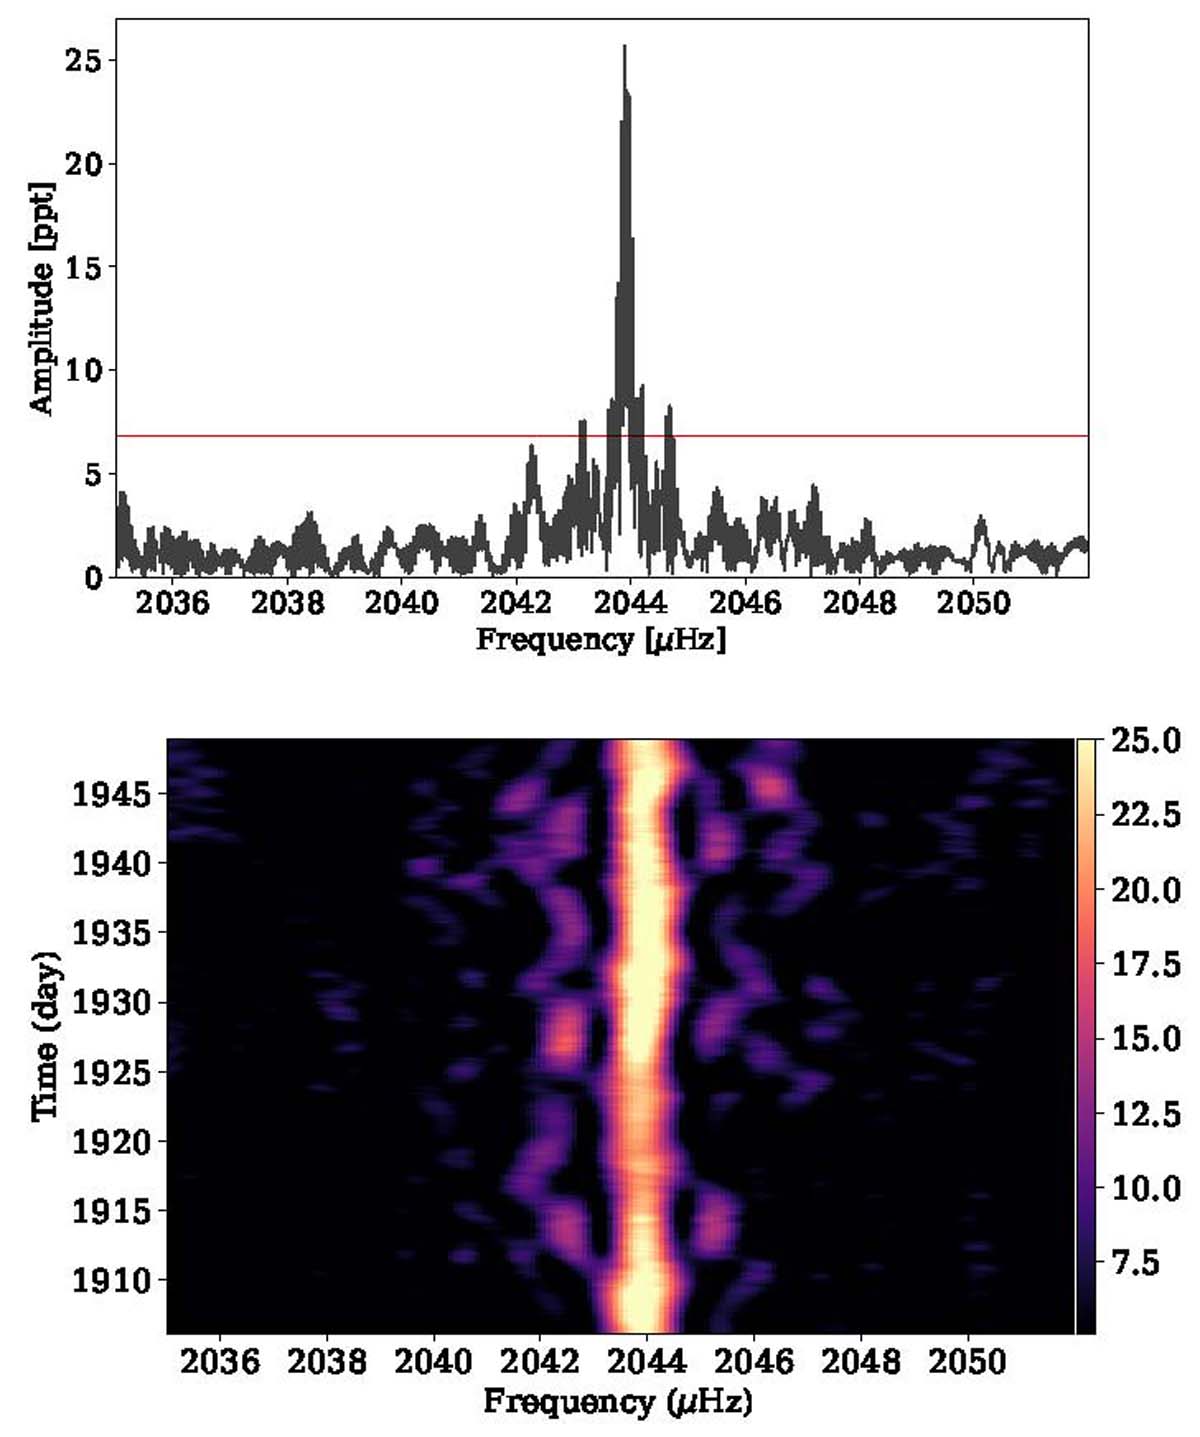
Top: Main pulsational mode in PG 1351 presented in Table 3. Fourier transform of data taken in sector 16, 22 and 23. The red dashed line denotes the 0.1% FAP. Bottom: Sliding Fourier transform sectors 22 and 23 of PG 1351+489 concentrating the main pulsational mode. The color-scale illustrates amplitude in ppt units.
Current usage metrics show cumulative count of Article Views (full-text article views including HTML views, PDF and ePub downloads, according to the available data) and Abstracts Views on Vision4Press platform.
Data correspond to usage on the plateform after 2015. The current usage metrics is available 48-96 hours after online publication and is updated daily on week days.
Initial download of the metrics may take a while.