Open Access
Fig. 11.
Download original image
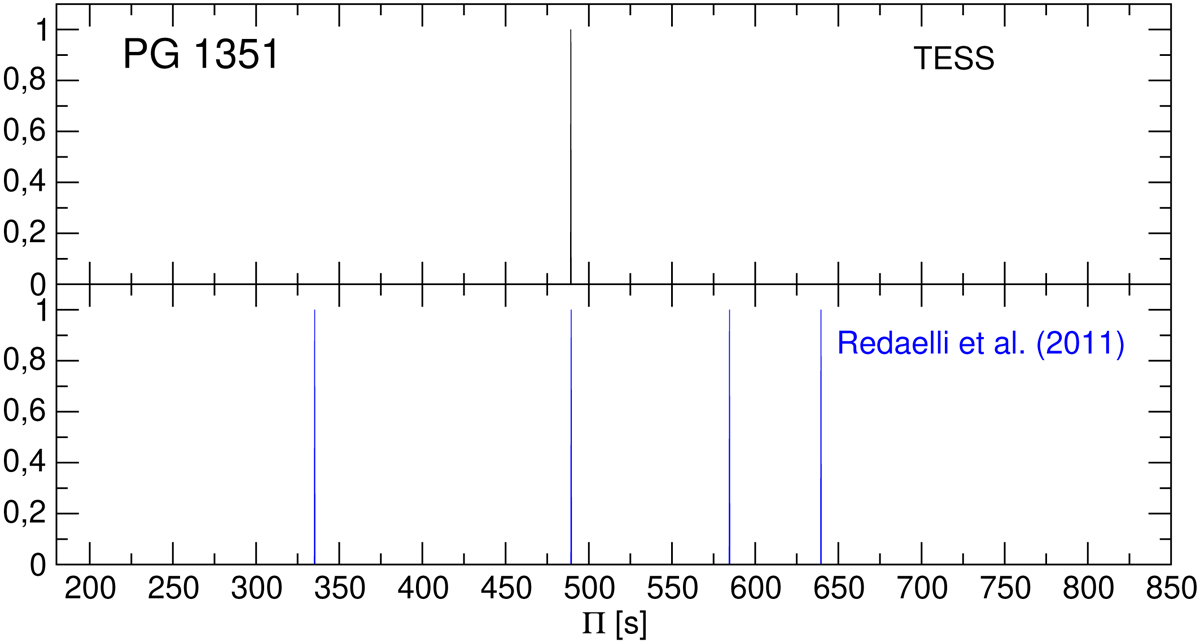
Schematic distribution of the pulsation periods of PG 1351 according to TESS (6 periods, black lines, upper panel), and according to Redaelli et al. (2011; 4 periods, blue lines, lower panel). The amplitudes have been arbitrarily set to one for clarity.
Current usage metrics show cumulative count of Article Views (full-text article views including HTML views, PDF and ePub downloads, according to the available data) and Abstracts Views on Vision4Press platform.
Data correspond to usage on the plateform after 2015. The current usage metrics is available 48-96 hours after online publication and is updated daily on week days.
Initial download of the metrics may take a while.