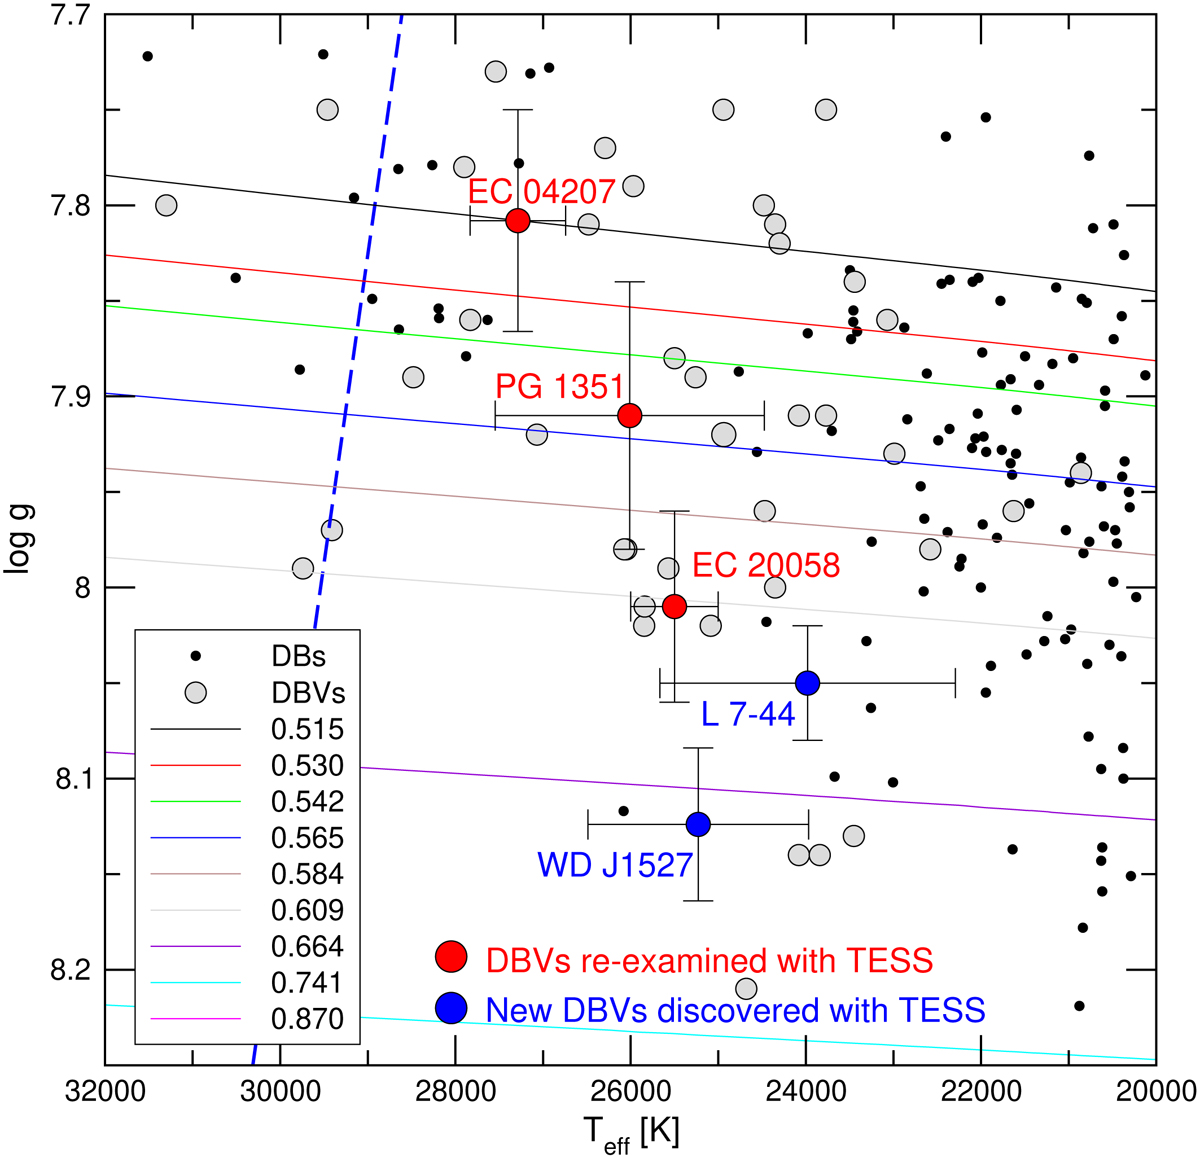
Fig. 1.
Download original image
Location of DB WDs in the Teff − log g diagram (Kepler et al. 2019), marked with small black circles. Also depicted is the location of the published DBV stars (gray circles), according to the compilation by Córsico et al. (2019a) and including also the newly discovered DBV stars by Duan et al. (2021) and Vanderbosch et al. (2022). The target stars of the present paper are highlighted with red circles corresponding to three already known DBVs, and with blue circles associated with the two new DBVs observed with TESS and reported here for the first time. The DB WD evolutionary tracks of Althaus et al. (2009) are displayed with different colors according to the stellar-mass values (in solar units). The blue-dashed line represents the theoretical dipole (ℓ = 1) blue edge of the DBV instability strip, according to Córsico et al. (2009).
Current usage metrics show cumulative count of Article Views (full-text article views including HTML views, PDF and ePub downloads, according to the available data) and Abstracts Views on Vision4Press platform.
Data correspond to usage on the plateform after 2015. The current usage metrics is available 48-96 hours after online publication and is updated daily on week days.
Initial download of the metrics may take a while.