Open Access
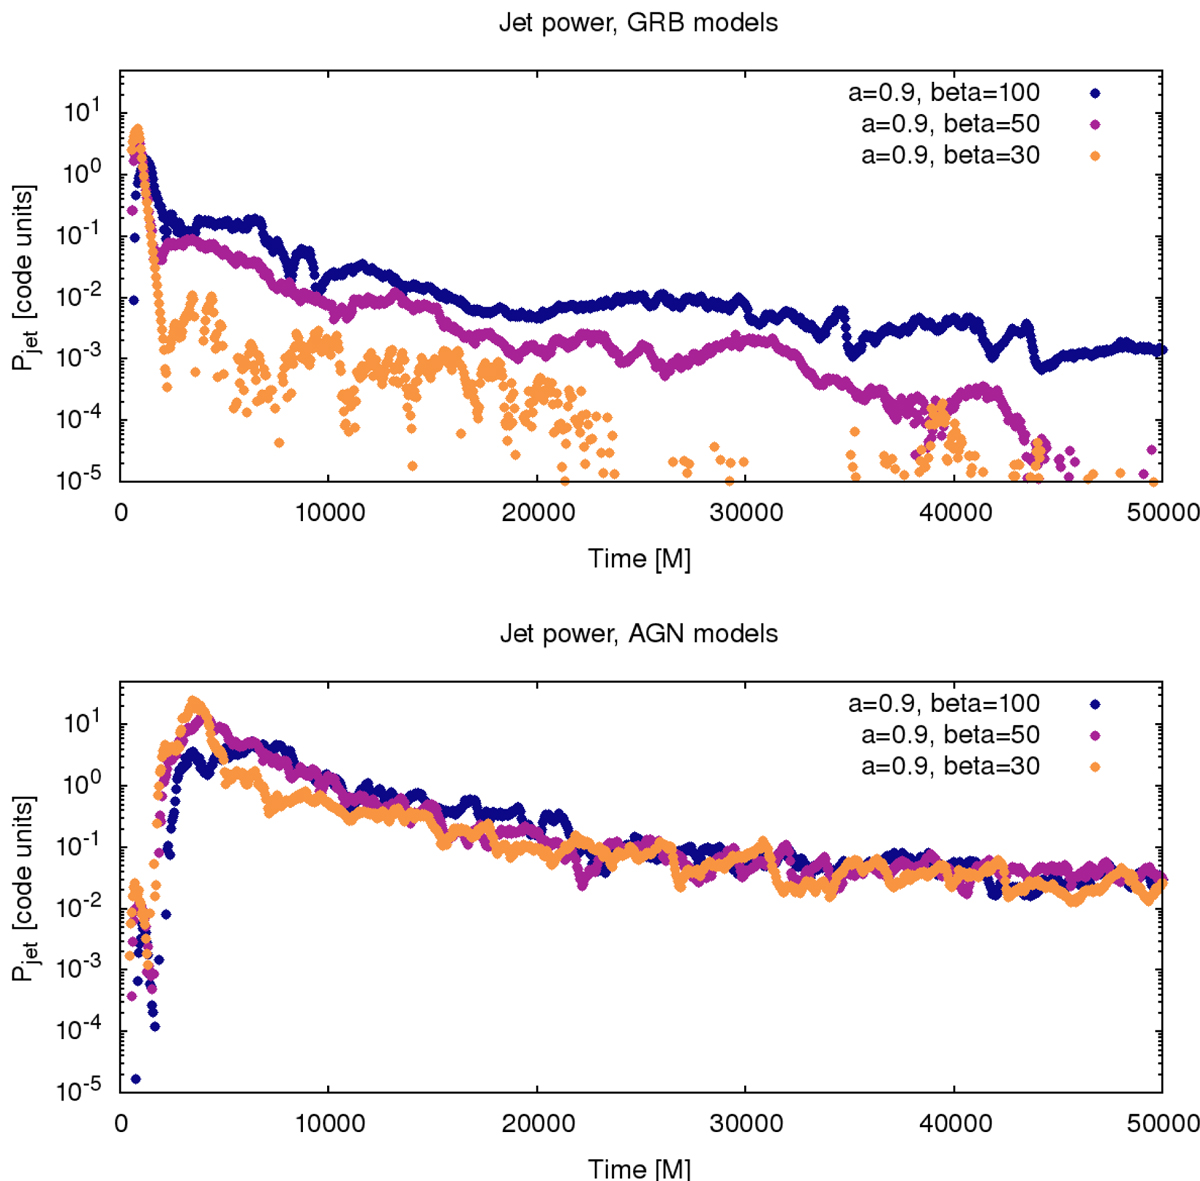
Fig. 8.
Download original image
Power of the Blandford-Znajek process, calculated from Eq. (6), as a function of time. We present models GRB-HS and AGN-HS, shown in the top and bottom panels, respectively. Three colors denote different initial disk β-parameters, shown with blue, red, and green points for β = 100, 50, and 30, respectively.
Current usage metrics show cumulative count of Article Views (full-text article views including HTML views, PDF and ePub downloads, according to the available data) and Abstracts Views on Vision4Press platform.
Data correspond to usage on the plateform after 2015. The current usage metrics is available 48-96 hours after online publication and is updated daily on week days.
Initial download of the metrics may take a while.