Open Access
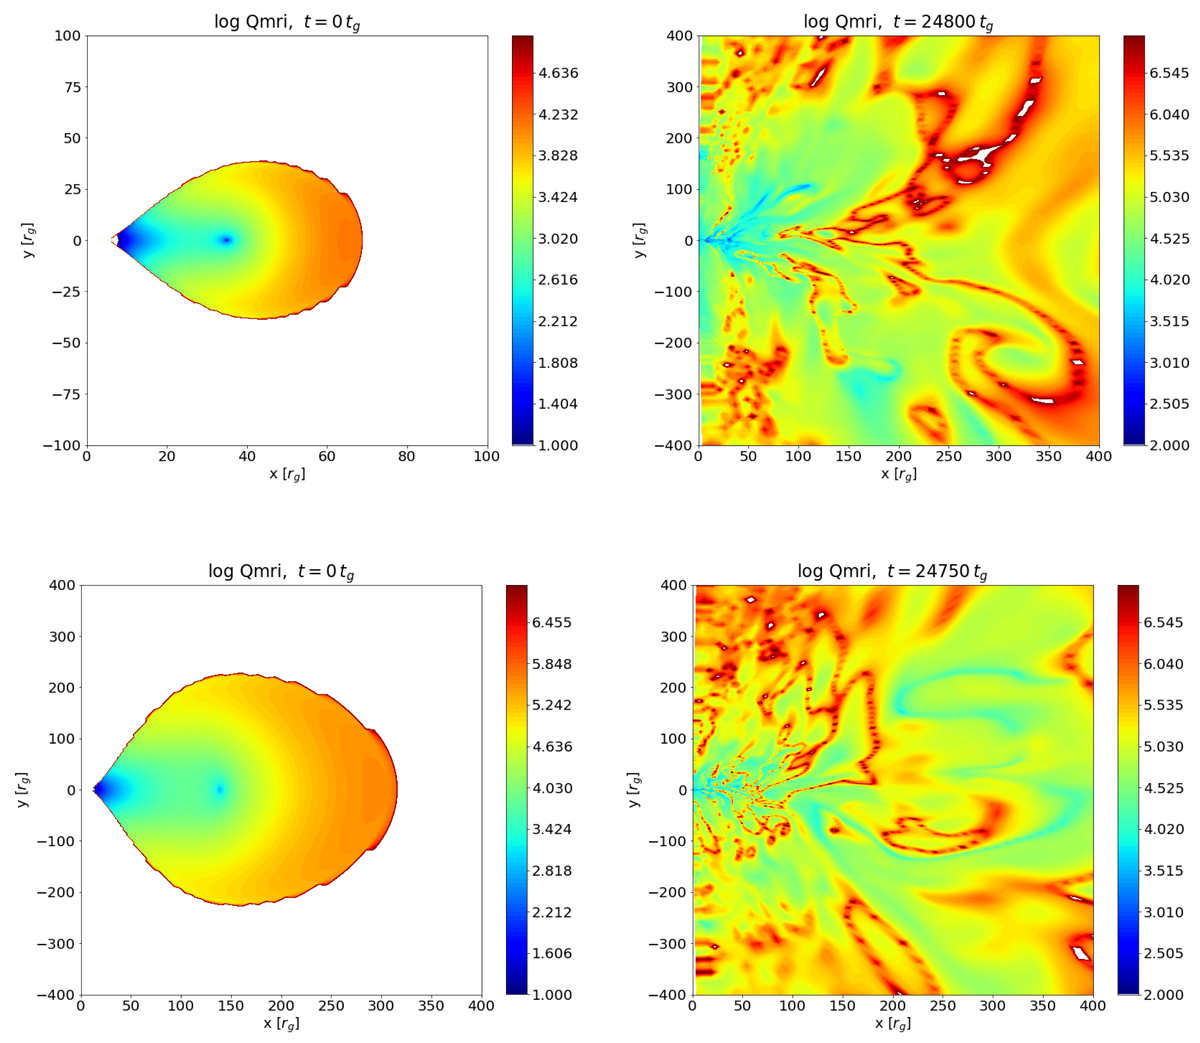
Fig. 11.
Download original image
Resolution of MRI instability, in the initial conditions and evolved state. The models are GRB-HS100 (top row) and AGN-HS100 (bottom row). The color maps are in logarithmic scale and are taken at t = 0 (left) and at the intermediate time of the simulation, at t ∼ 25 000 M (right).
Current usage metrics show cumulative count of Article Views (full-text article views including HTML views, PDF and ePub downloads, according to the available data) and Abstracts Views on Vision4Press platform.
Data correspond to usage on the plateform after 2015. The current usage metrics is available 48-96 hours after online publication and is updated daily on week days.
Initial download of the metrics may take a while.