Fig. 2.
Download original image
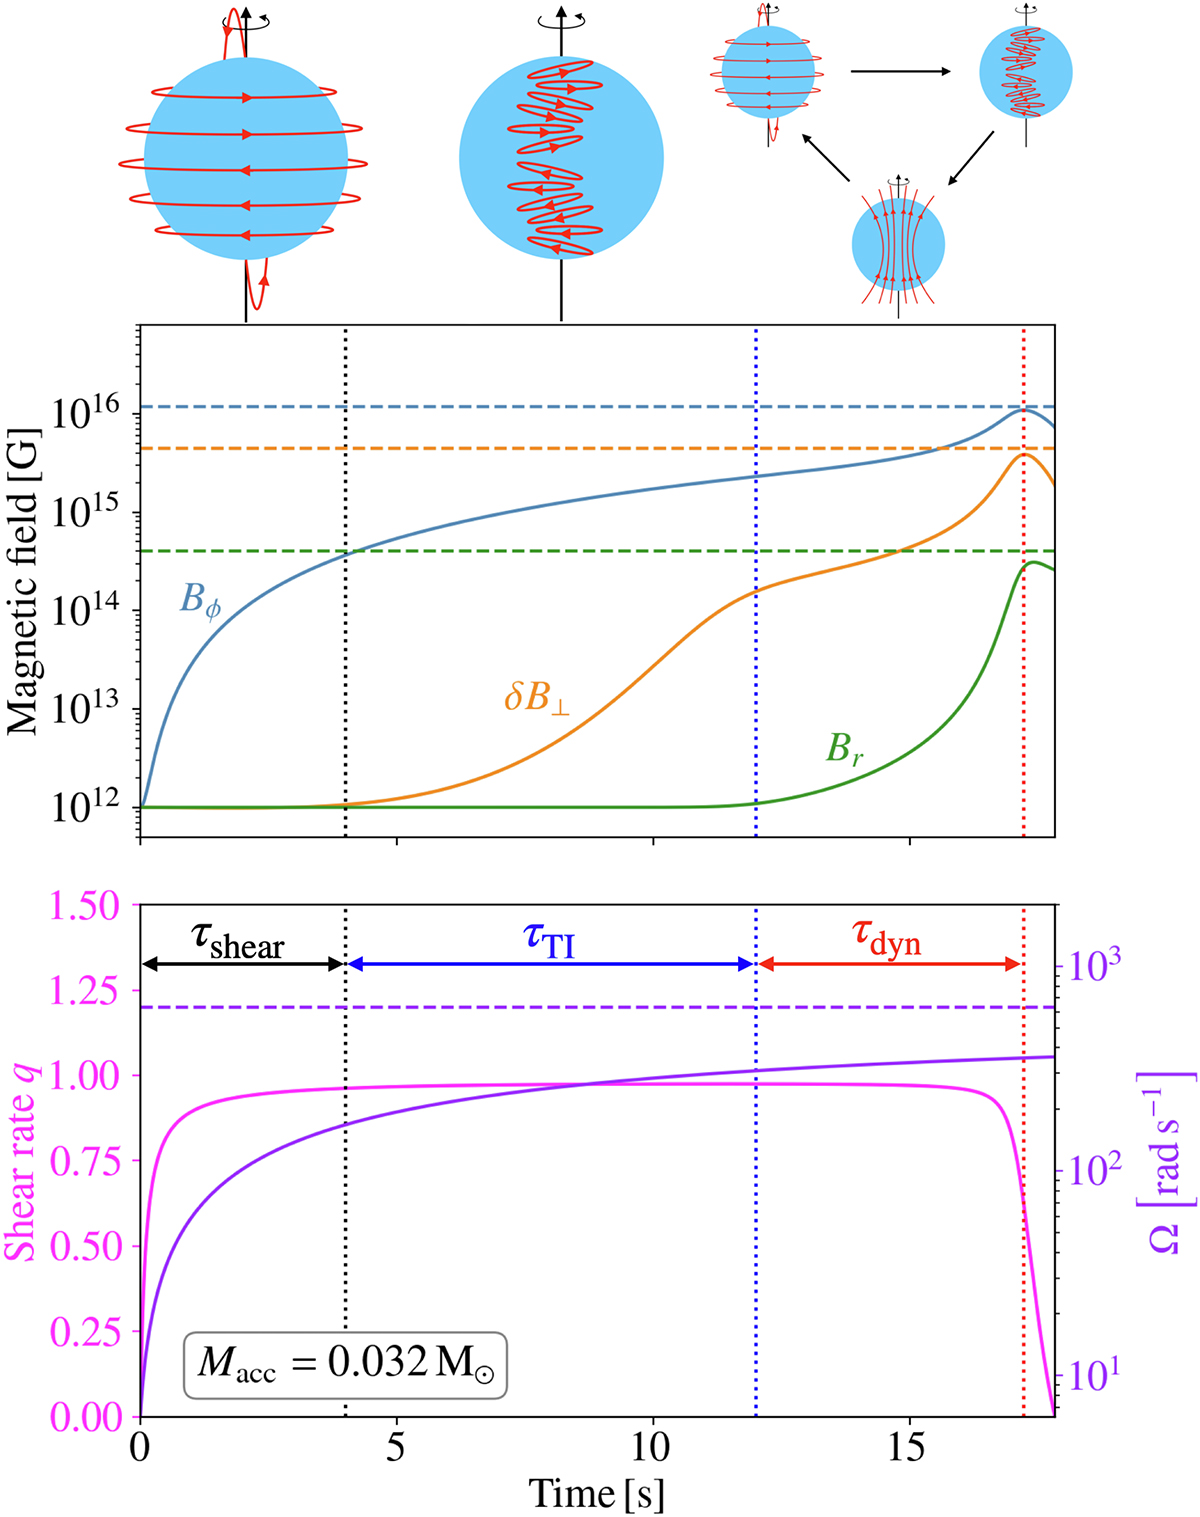
Time evolution of the different components of the magnetic field (top), the dimensionless shear rate, and the angular rotation frequency (bottom) for an accreted mass Macc = 3.2 × 10⁻² M⊙ corresponding to an asymptotic rotation period Pfin = 10 ms. The different stages of the dynamo process are highlighted by the schematics at the top and their associated timescales by the double arrows. Their ends are illustrated by the dotted vertical lines: winding (black), linear development of the Tayler instability (dark blue), and the whole dynamo loop (red). The horizontal dashed lines (blue, orange, and green) show respectively the saturation intensities ![]() , and
, and ![]() (Eqs. 37–39) evaluated at the time of saturation. The dashed violet horizontal line represents the asymptotic angular rotation frequency Ωfin.
(Eqs. 37–39) evaluated at the time of saturation. The dashed violet horizontal line represents the asymptotic angular rotation frequency Ωfin.
Current usage metrics show cumulative count of Article Views (full-text article views including HTML views, PDF and ePub downloads, according to the available data) and Abstracts Views on Vision4Press platform.
Data correspond to usage on the plateform after 2015. The current usage metrics is available 48-96 hours after online publication and is updated daily on week days.
Initial download of the metrics may take a while.