Fig. 2
Download original image
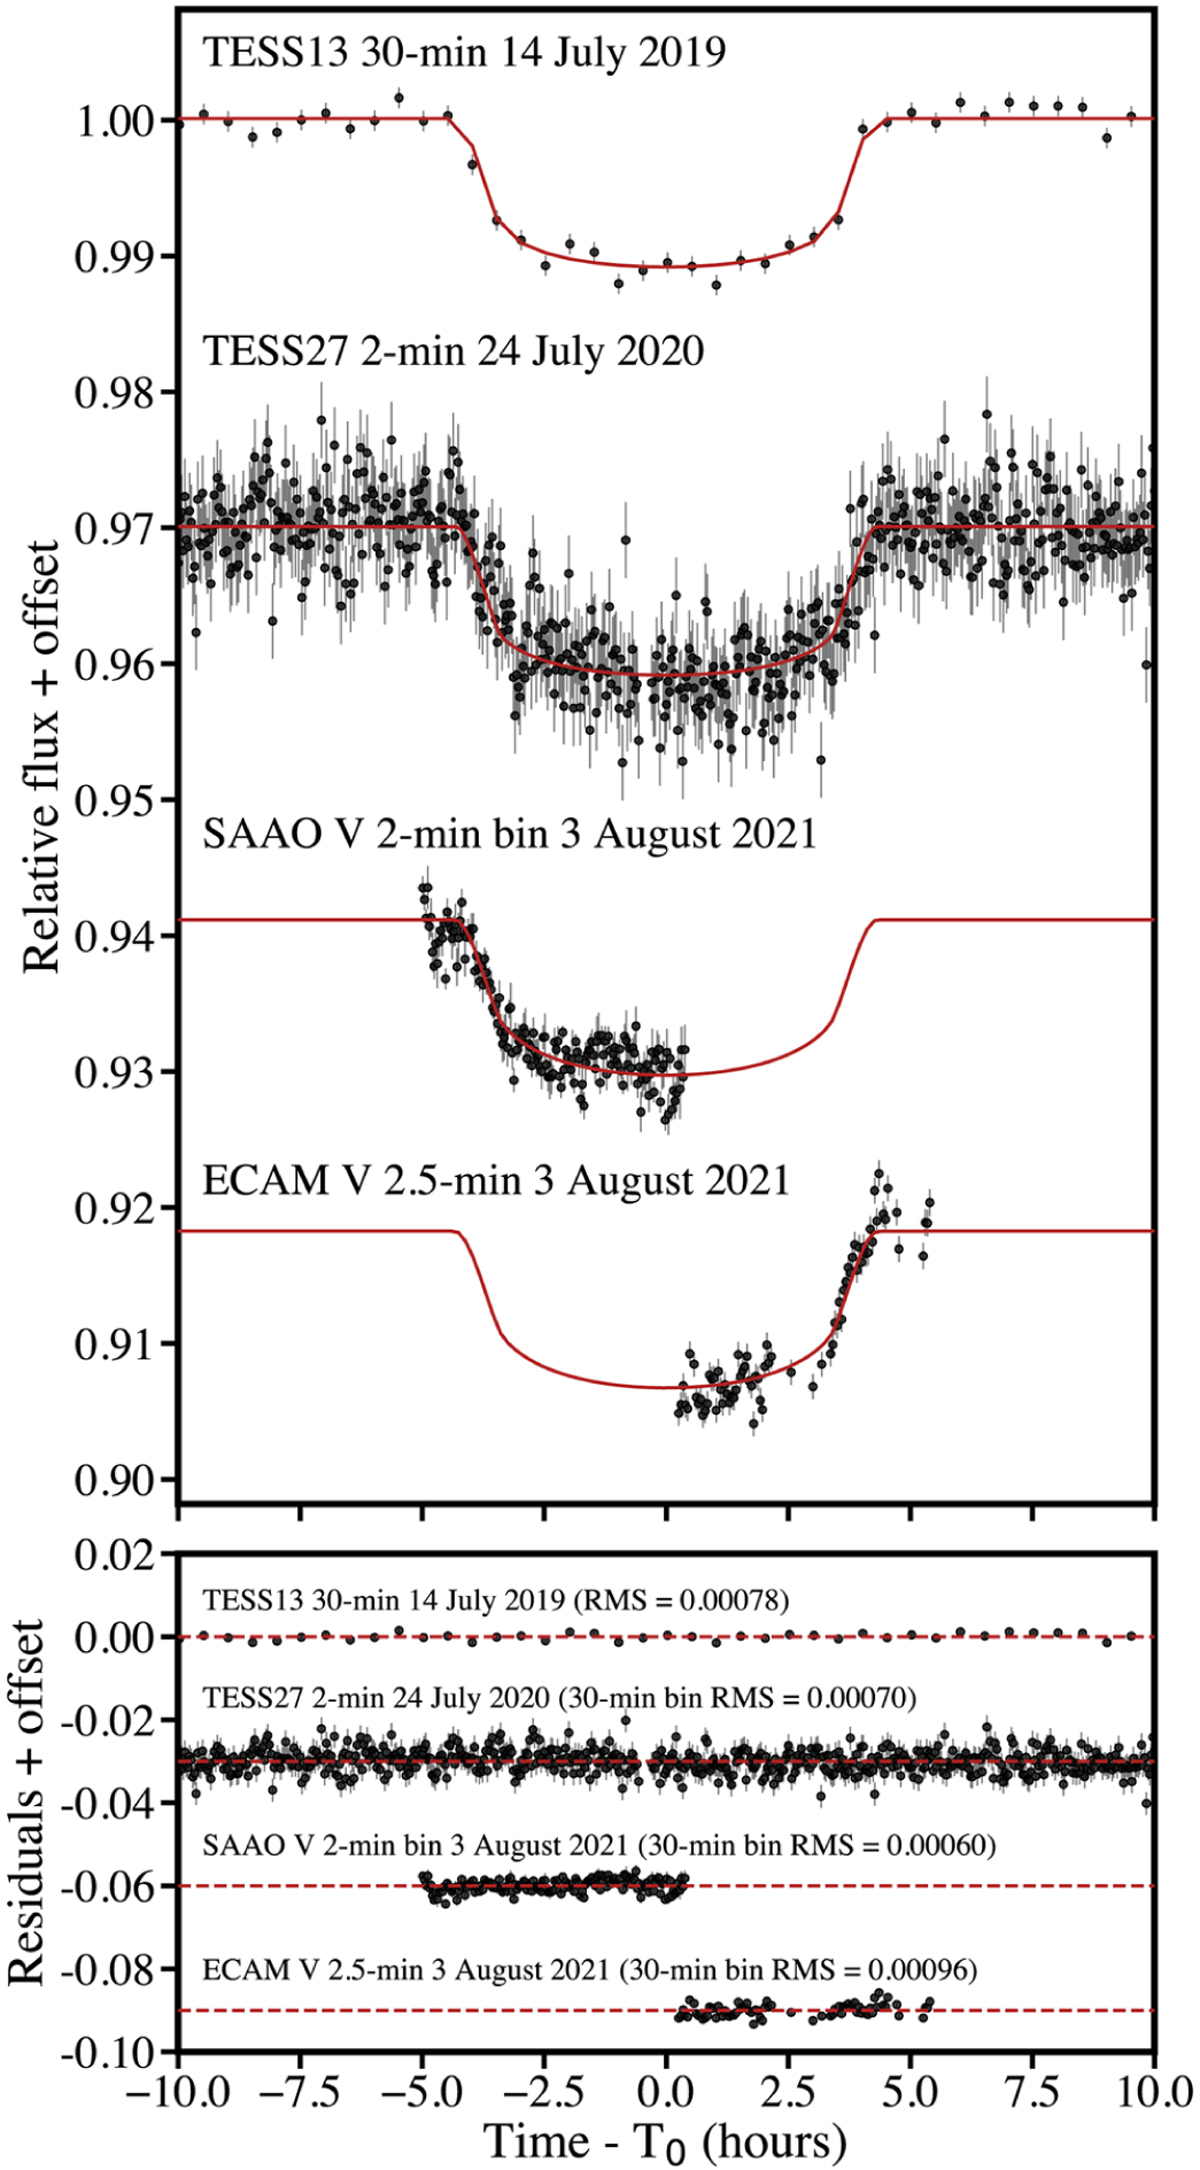
Light curves around each transit of TOI-5542b from the respective facilities, as described Sect. 2 (top). The SAAO data is binned to 2 min for visual purposes. The red lines show the best-fit transit model to each photometry data set from our juliet analysis, as described in Sect. 3.2. TESS Sectors 13 and 27 data have the Gaussian process component of their models removed. Residuals of each transit fit and the root mean square (rms) of the residuals for each data set (bottom). The rms values for TESS27, SAAO, and EulerCam are calculated with the data binned to 30 min for comparison.
Current usage metrics show cumulative count of Article Views (full-text article views including HTML views, PDF and ePub downloads, according to the available data) and Abstracts Views on Vision4Press platform.
Data correspond to usage on the plateform after 2015. The current usage metrics is available 48-96 hours after online publication and is updated daily on week days.
Initial download of the metrics may take a while.