Fig. 4.
Download original image
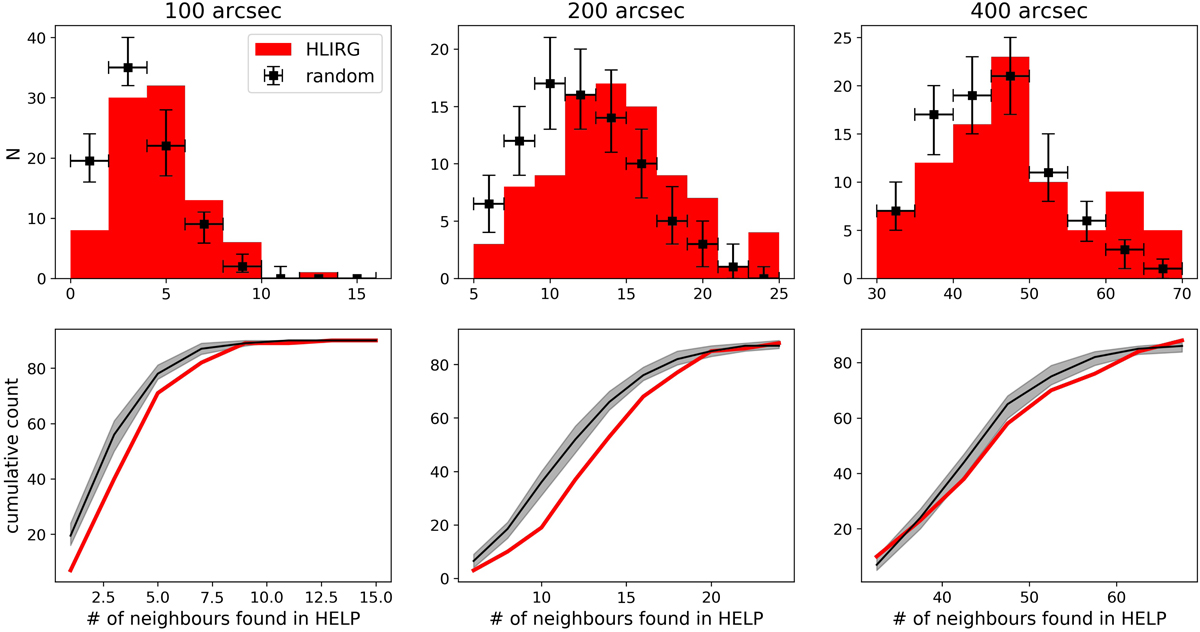
Comparing the number of neighbors around HLIRGs to that around random positions. Upper panel: number distributions of deblended 250 μm galaxies around HLIRGs within 100, 200, and 400″, respectively. The black symbols and error bars are the median value and 16th/84th percentiles calculated from 100 realizations of random galaxies. Bottom: cumulative distribution function (CDF) of the number of HLIRG neighbors and random neighbors. HLIRGs on average have more 250 μm neighbors than random positions. This difference becomes weaker as radius increases, reducing from 3.7σ within 100″ to 2.7σ within 200″, and 1.6σ within 400″, respectively.
Current usage metrics show cumulative count of Article Views (full-text article views including HTML views, PDF and ePub downloads, according to the available data) and Abstracts Views on Vision4Press platform.
Data correspond to usage on the plateform after 2015. The current usage metrics is available 48-96 hours after online publication and is updated daily on week days.
Initial download of the metrics may take a while.