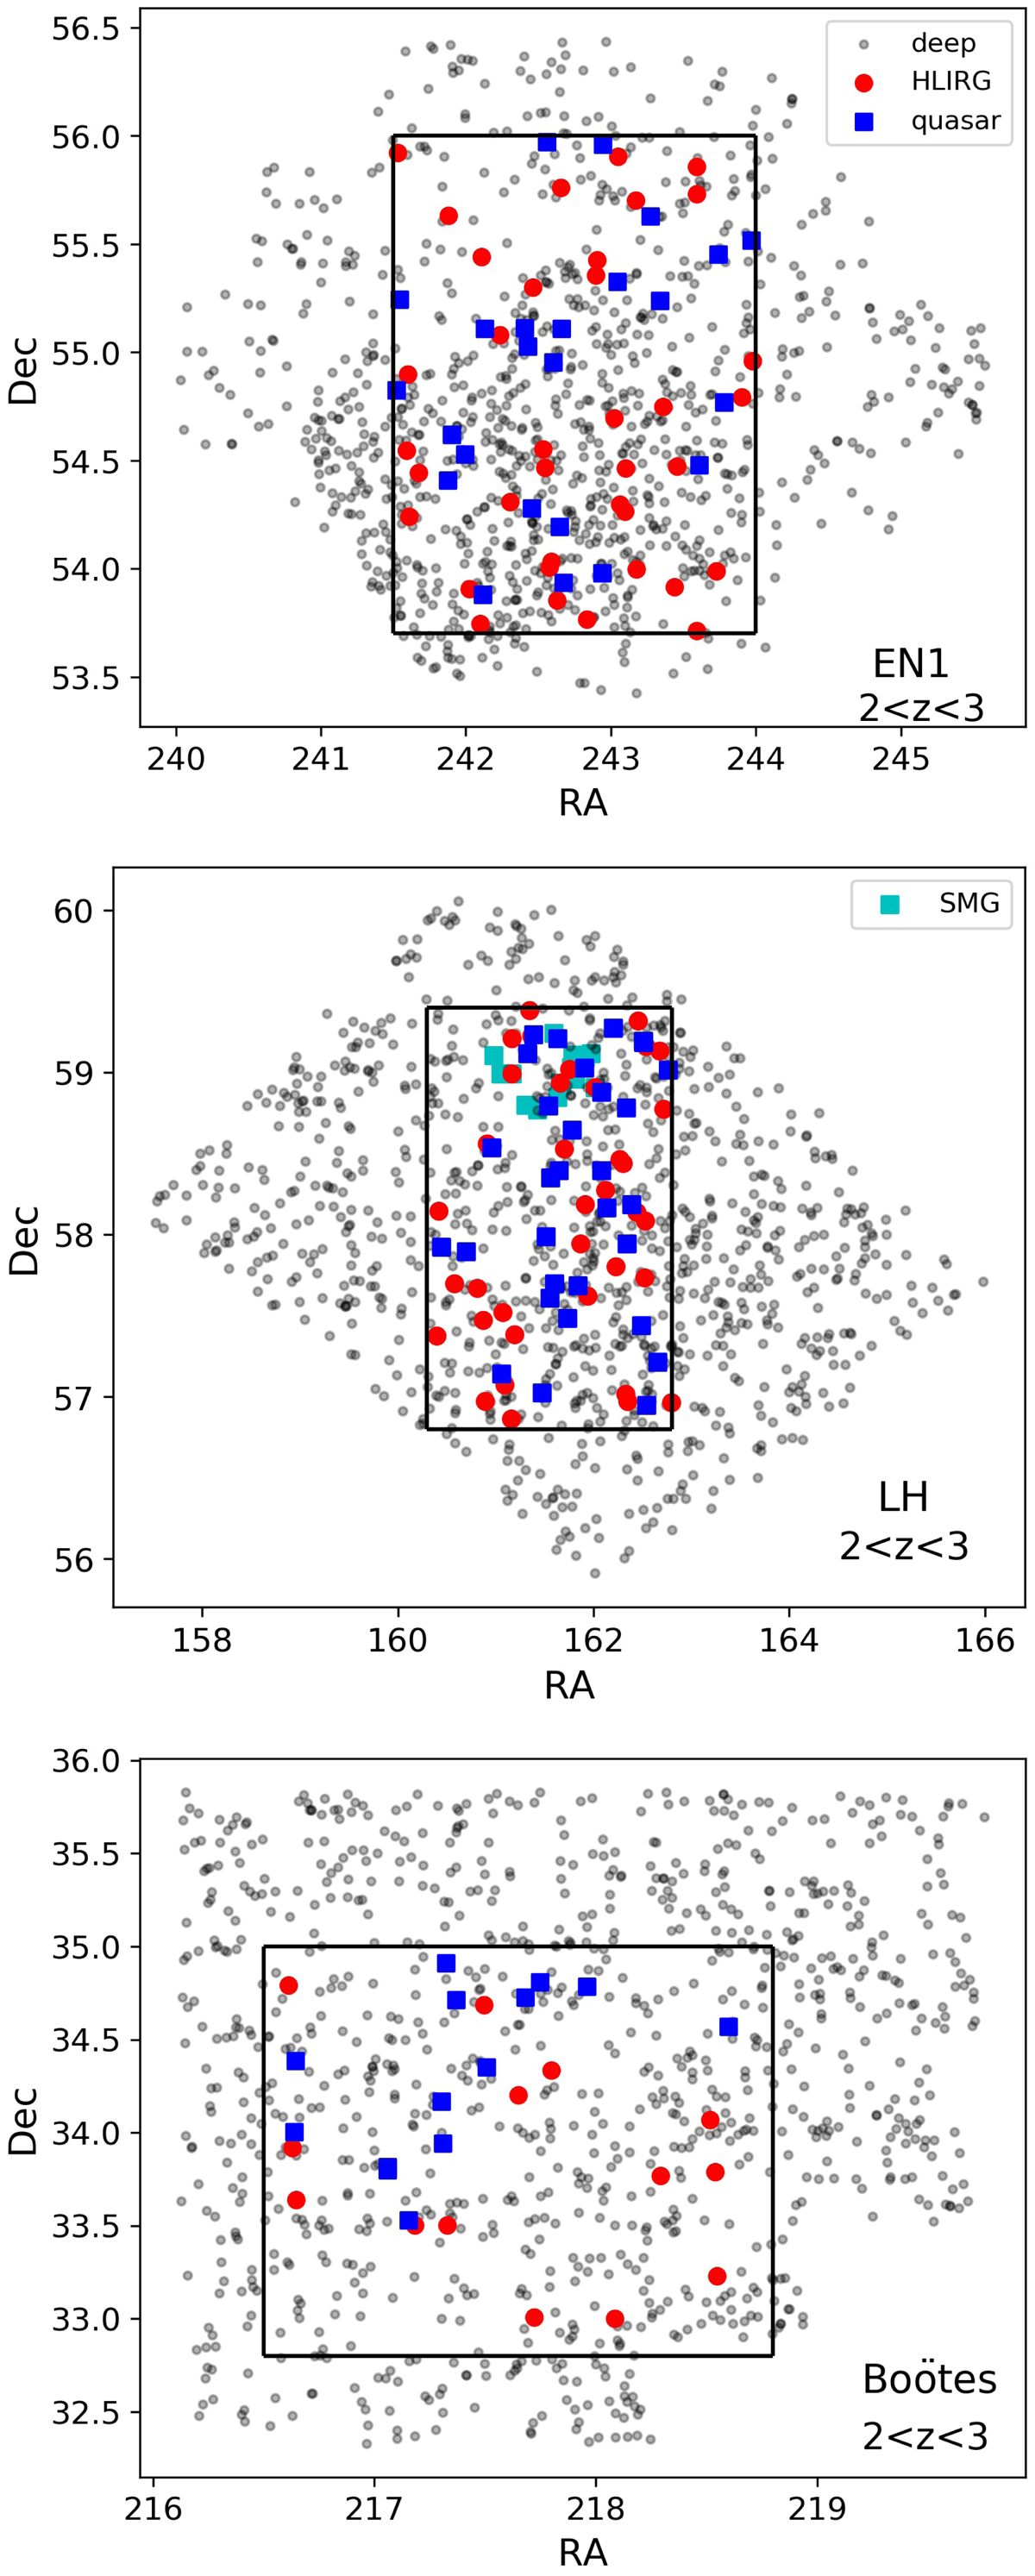
Fig. 2.
Download original image
Sky distributions of the various samples used in this study. Black dots are 1000 randomly selected sources from the deep IRAC-selected photo-z catalogs at 2 < z < 3 for clarity. We require all samples to be located inside the central black boxes in order to avoid searching for neighbors outside of the sky area coverage. HLIRGs at 2 < z < 3, redshift-matched quasars and SMGs (only in the LH field) are plotted as red circles, blue squares, and cyan squares respectively.
Current usage metrics show cumulative count of Article Views (full-text article views including HTML views, PDF and ePub downloads, according to the available data) and Abstracts Views on Vision4Press platform.
Data correspond to usage on the plateform after 2015. The current usage metrics is available 48-96 hours after online publication and is updated daily on week days.
Initial download of the metrics may take a while.