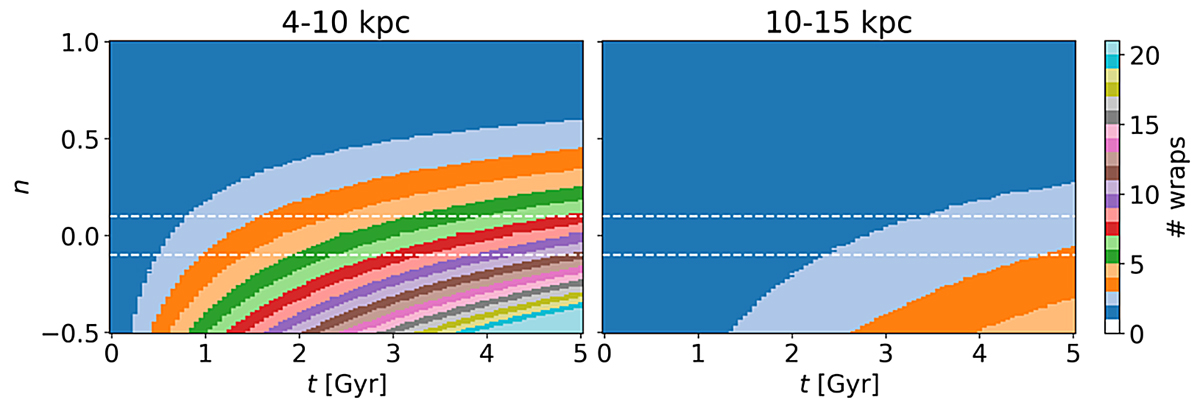
Fig. 5.
Download original image
Number of spiral wraps. We show in colours the expected maximum number of spiral wraps at different radius ranges (4–10 and 10–15 kpc in the first and second columns, respectively) as a function of time t and slope of the circular velocity curve n. We have used 21 for the upper limit of the colour bar but the number of wraps goes beyond this in the bottom part of the left panel.
Current usage metrics show cumulative count of Article Views (full-text article views including HTML views, PDF and ePub downloads, according to the available data) and Abstracts Views on Vision4Press platform.
Data correspond to usage on the plateform after 2015. The current usage metrics is available 48-96 hours after online publication and is updated daily on week days.
Initial download of the metrics may take a while.