Open Access
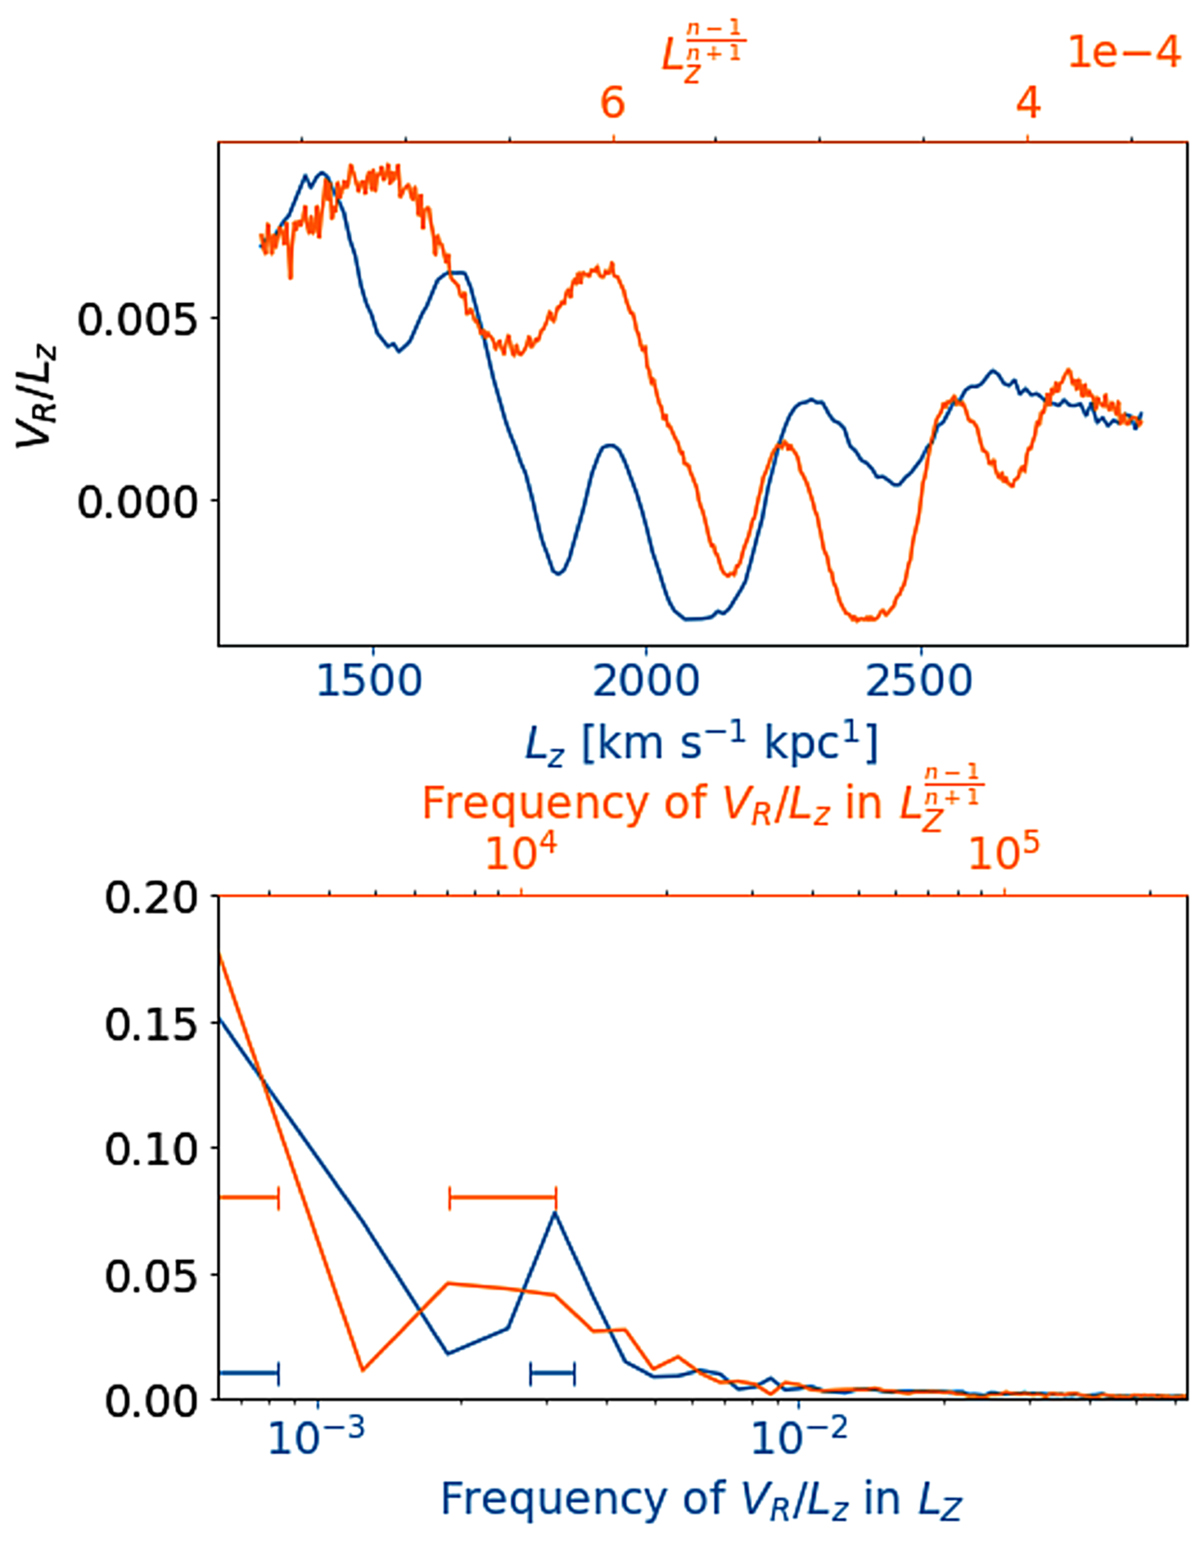
Fig. 26.
Download original image
Frequency analysis of the VR wave in the MW data. The plot is built as in Fig. 12. The orange curves are for n = 0, which is one example of the different cases examined. The horizontal error bars indicate the uncertainty in the peaks frequency (see text for details).
Current usage metrics show cumulative count of Article Views (full-text article views including HTML views, PDF and ePub downloads, according to the available data) and Abstracts Views on Vision4Press platform.
Data correspond to usage on the plateform after 2015. The current usage metrics is available 48-96 hours after online publication and is updated daily on week days.
Initial download of the metrics may take a while.