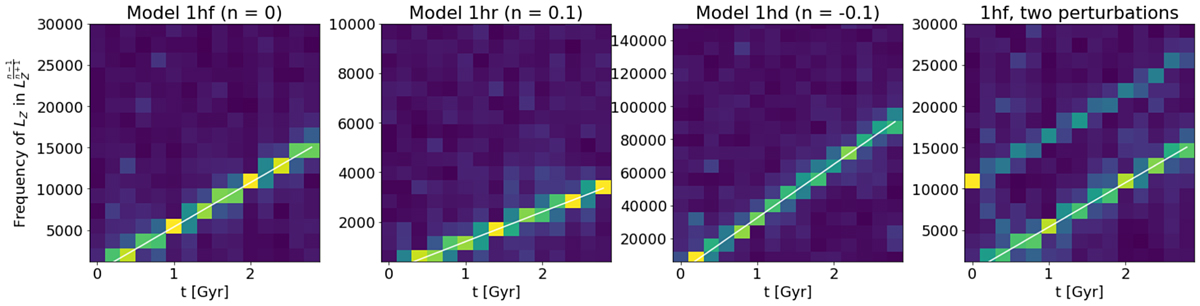
Fig. 13.
Download original image
Frequency analysis of the VR wave for different models. From left to right: we show Models 1hf, 1hr, 1hd, and 1hf with 2 perturbations. The colour indicates the amplitude of the Fourier transform as a function of time when the LZ is transformed to ![]() . The diagonal lines in all models show the increase in frequency with time, which is faster for the decreasing circular velocity curve mode (1hd). In the ideal model with two perturbations, two lines of the frequency corresponding to the two different impacts are detected at all times.
. The diagonal lines in all models show the increase in frequency with time, which is faster for the decreasing circular velocity curve mode (1hd). In the ideal model with two perturbations, two lines of the frequency corresponding to the two different impacts are detected at all times.
Current usage metrics show cumulative count of Article Views (full-text article views including HTML views, PDF and ePub downloads, according to the available data) and Abstracts Views on Vision4Press platform.
Data correspond to usage on the plateform after 2015. The current usage metrics is available 48-96 hours after online publication and is updated daily on week days.
Initial download of the metrics may take a while.