Fig. 12.
Download original image
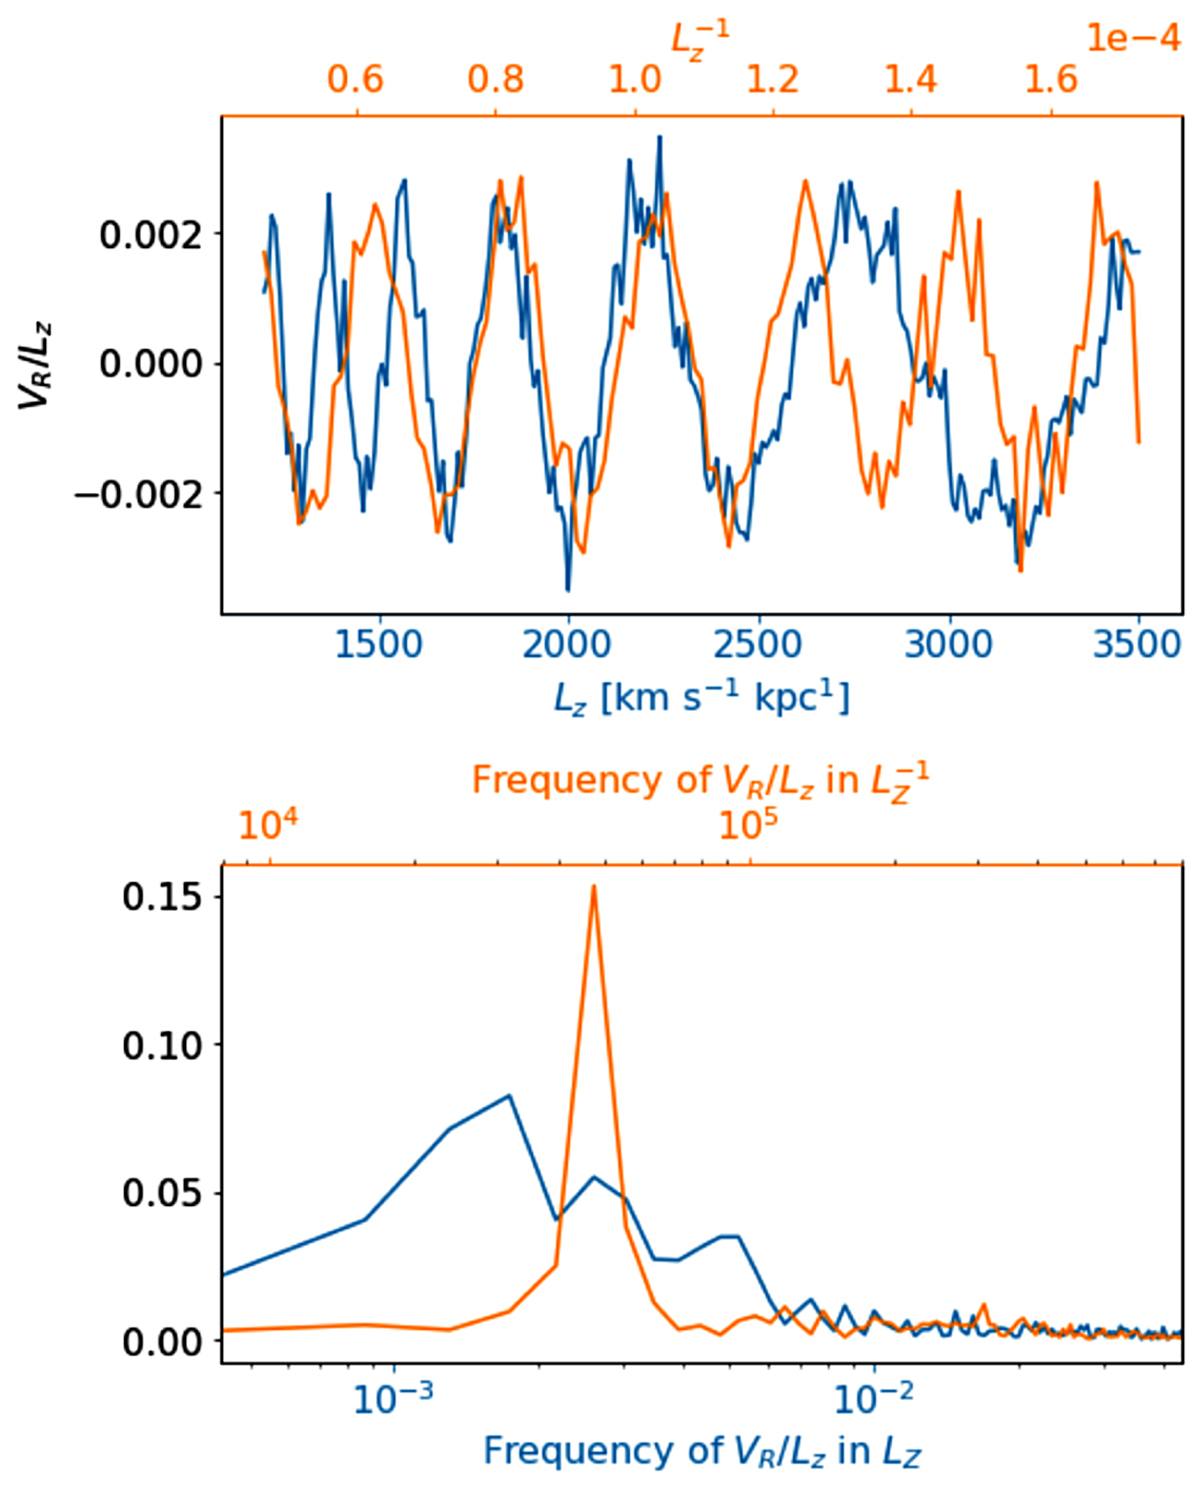
Example of frequency analysis of the VR wave for the Model 1hf at time t = 2 Gyr. Top: blue line is the average VR as a function of LZ, while the orange line is in the scale of ![]() , shown in the top horizontal axis. Bottom: fourier amplitude as a function of frequency in LZ (blue and bottom axis) and in
, shown in the top horizontal axis. Bottom: fourier amplitude as a function of frequency in LZ (blue and bottom axis) and in ![]() (orange, top axis). The frequencies are in units of (km s−1 kpc−1)−1 (blue) and km s−1 kpc−1 (orange).
(orange, top axis). The frequencies are in units of (km s−1 kpc−1)−1 (blue) and km s−1 kpc−1 (orange).
Current usage metrics show cumulative count of Article Views (full-text article views including HTML views, PDF and ePub downloads, according to the available data) and Abstracts Views on Vision4Press platform.
Data correspond to usage on the plateform after 2015. The current usage metrics is available 48-96 hours after online publication and is updated daily on week days.
Initial download of the metrics may take a while.