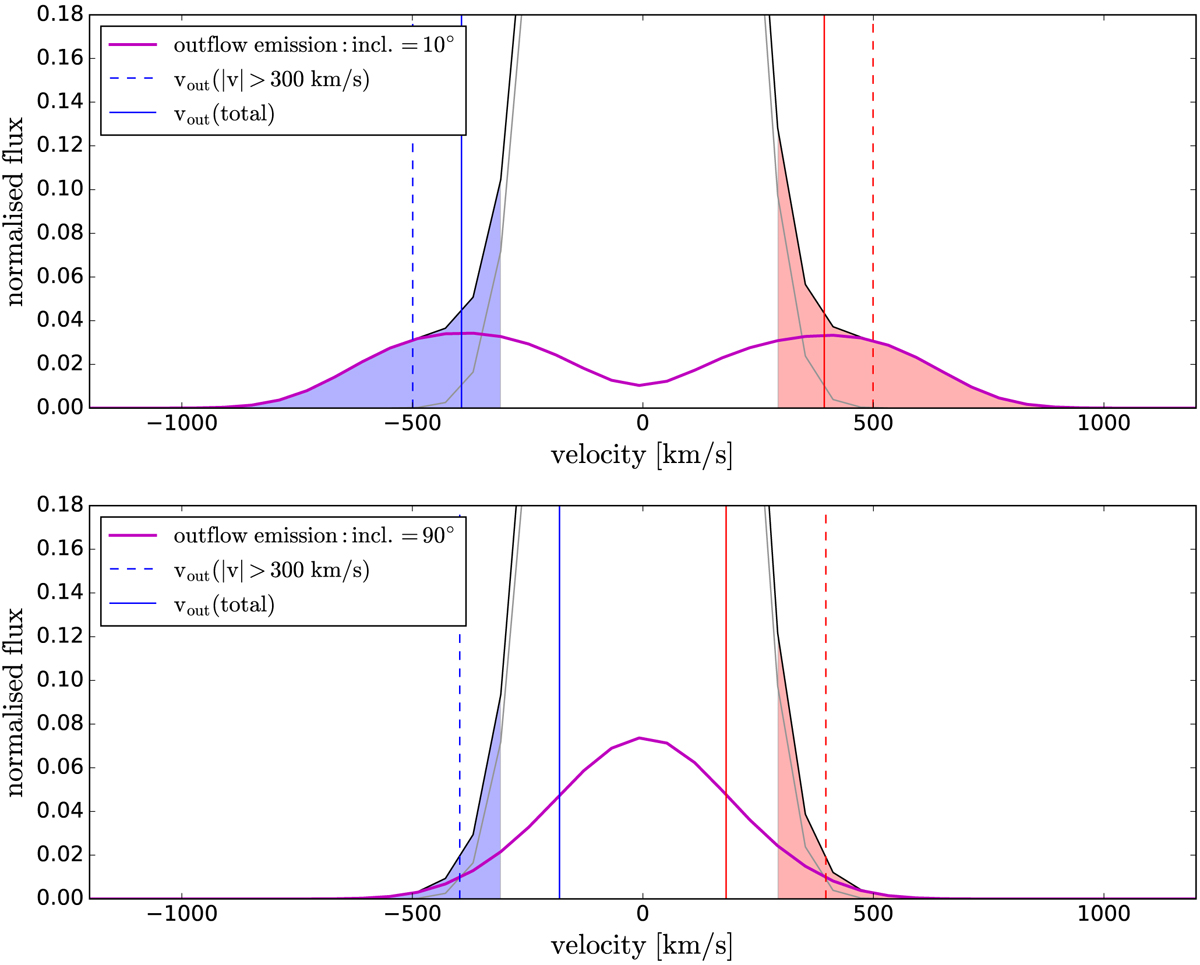
Fig. 6.
Download original image
Simulated outflow profiles for outflow inclinations with respect to our line of sight of 10° (upper) and 90° (bottom). The outflow velocity in this particular simulation increases up to a turnover radius and then decreases. Up to four different velocity fields are considered in Appendix A. The magenta curve shows the outflow component, the grey curve the systemic component and the black curve the total profile. The vertical dashed lines show the flux-weighted vout measured from the total profile at |v|≥300 km s−1 (coloured in blue and red). The vertical solid lines show the flux-weighted vout measured from the outflow component over the full velocity range. For high outflow inclination (close to the plane of the sky), the contribution to the outflow flux by the gas at low projected velocities (|v|< 300 km s−1) increases.
Current usage metrics show cumulative count of Article Views (full-text article views including HTML views, PDF and ePub downloads, according to the available data) and Abstracts Views on Vision4Press platform.
Data correspond to usage on the plateform after 2015. The current usage metrics is available 48-96 hours after online publication and is updated daily on week days.
Initial download of the metrics may take a while.