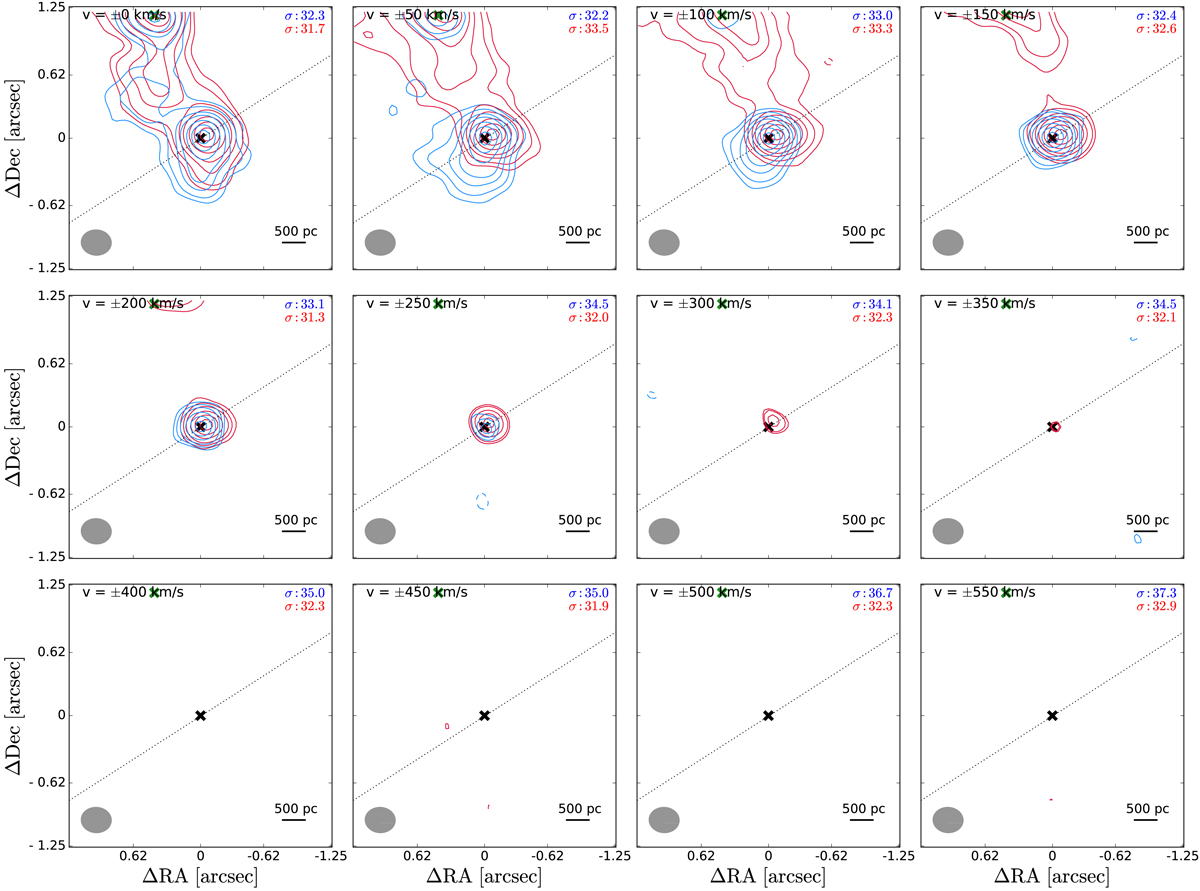
Fig. F.1.
Download original image
CO channel maps of 00091-0738 S showing the emission in channels of 50 km s−1 on the blue and red-shifted side with respect to the CO redshift (zCO). The lowest contour corresponds to 3×σ, where σ is the rms measured in each 50 km s−1 channel (in mJy), and the other contours correspond to 0.1, 0.2, 0.3, 0.5, 0.7, 0.9× maximum flux. Contours are shown only if they are above the 3×σ level. Dashed contours show negative -3, -4, -5 ...×σ levels. The σ values (in mJy) for the blue and red channels are indicated in the top-right corner. The dotted line shows the kinematic major axis, the dashed line shows the direction of the outflow (if present). The black cross shows the peak position of the ALMA continuum. The green cross shows the continuum position of the second nucleus in interacting systems. The CO channel maps for the rest of the sample can be found at bluehttps://doi.org/10.5281/zenodo.7022665.
Current usage metrics show cumulative count of Article Views (full-text article views including HTML views, PDF and ePub downloads, according to the available data) and Abstracts Views on Vision4Press platform.
Data correspond to usage on the plateform after 2015. The current usage metrics is available 48-96 hours after online publication and is updated daily on week days.
Initial download of the metrics may take a while.