Fig. 3.
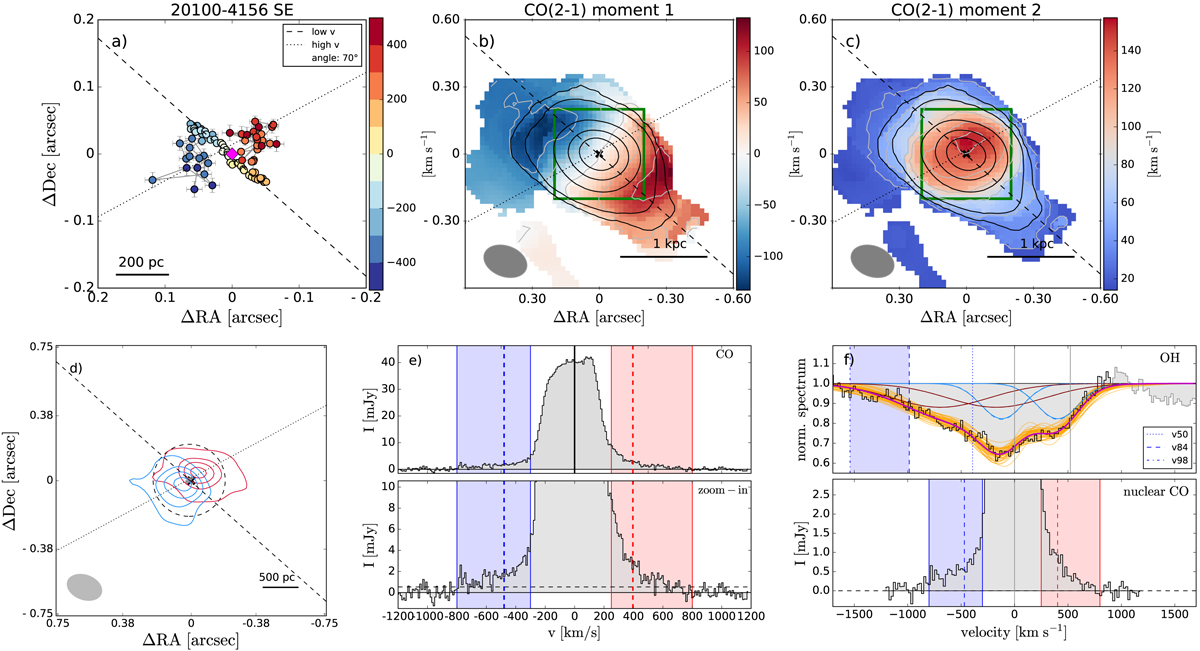
Download original image
Example of spectro-astrometry and outflow maps for one target (20100−4156 SE) with outflow direction perpendicular to the kinematic major axis. Panel a: spectro-astrometry of the CO(2–1) emission line, i.e. centroid position of the CO(2–1) emission in the different velocity channels. The points are colour-coded by the channel velocity. The pink diamond indicates the peak ALMA millimetre continuum position. The dashed line is a linear fit to the low-velocity points (kinematic major axis) and the dotted line is a fit to the high-velocity points (indicating the outflow direction, if present). Panels b,c: moment 1 and moment 2 maps, where the green square indicate the field of view of panel a. The grey ellipse illustrates the ALMA beam FWHM. The grey contours on the moment 1 maps are every 50 km s−1 (every 25 km s−1 if the maximum value < 100 km s−1), and every 25 km s−1 (every 15 km s−1 if the maximum value < 150 km s−1) on the moment 2 map. In black are the CO(2–1) moment 0 contours ([3, 6, 25, 50, 75] × σ). Panel d: emission of the high-velocity channels, integrated over the velocity ranges indicated on the CO(2–1) spectrum (shown in panel e). Blue- and red-shifted channels are shown with blue and red contours, respectively (dashed lines indicate negative contour levels). The lowest contour corresponds to the 3σ level. The next contour levels are (0.5, 0.7, 0.9) of the peak of the emission, if these are above the 3σ level. The dashed circle shows the size of the outflow (Rout). Panel e: CO(2–1) continuum-subtracted spectrum extracted from a circle with radius equivalent to the outflow size (Rout). The lower panel shows an y-axis zoom-in to highlight the emission in the wings. The horizontal dashed line shows the 1σ noise level. The vertical dashed lines indicated the ‘flux-weighted’ velocity of the blue and red-shifted outflow (vout). Panel f: OH 119 μm spectrum (upper) compared with the nuclear CO(2–1) spectrum (bottom), convolved to the resolution of the OH spectrum (FWHM ∼ 270 km s−1). The total fit to the OH lines is shown with a magenta line, while the Gaussian components of the fit are shown in lightblue and brown. The orange lines show the 50 Monte Carlo iterations used to estimate the uncertainties on the fit (see Sect. 4.7). The vertical dotted, dashed and dot-dashed lines show the v50, v84, and v98 percentile velocities, respectively. The blue-shaded area in the upper panel shows the wavelength range between v84 and v98. Figures for the rest of the sample are in the appendix.
Current usage metrics show cumulative count of Article Views (full-text article views including HTML views, PDF and ePub downloads, according to the available data) and Abstracts Views on Vision4Press platform.
Data correspond to usage on the plateform after 2015. The current usage metrics is available 48-96 hours after online publication and is updated daily on week days.
Initial download of the metrics may take a while.