Fig. C.1.
Download original image
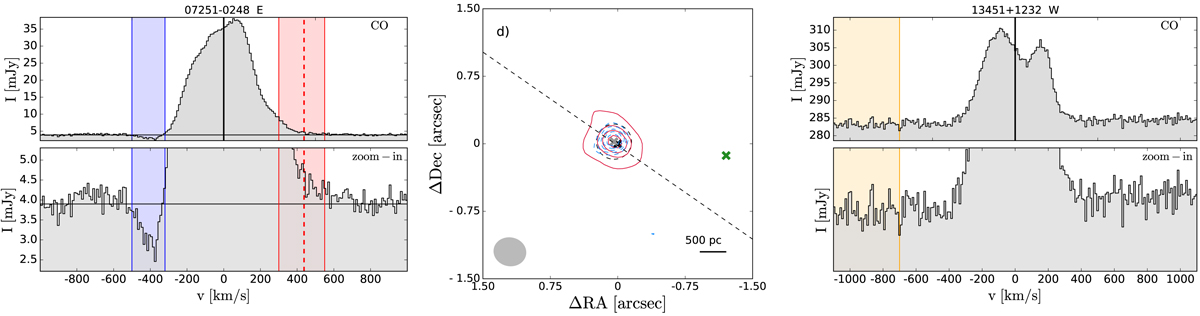
Left: CO(2–1) spectrum (with continuum) of 07251-0248 E, showing an absorption at velocities v = [ − 320, −500] km s−1. Middle: Emission of the blue- and red-shifted high-velocity channels of 07251-0248 E, shown with blue and red contours, respectively. The lowest contour corresponds to the 3σ level. The next contour levels are (0.5, 0.7, 0.9) of the peak of the emission. Dashed lines indicate negative contour levels ([-3, -4, -5, -6, -7]×σ). The dashed black circle shows the size of the outflow (Rout) and the grey cross the central position of the outflow. The black and green crosses shows the position of the continuum peaks of the E and W nuclei, respectively. Right: CO(2–1) spectrum (with continuum) of 13451+1232 W. No clear absorption is detected in this spectrum at the velocities of the an absorption detected in the CO(3–2) spectrum by Dasyra & Combes (2012) at v = [ − 700, −1200] km s−1 (see orange shaded region).
Current usage metrics show cumulative count of Article Views (full-text article views including HTML views, PDF and ePub downloads, according to the available data) and Abstracts Views on Vision4Press platform.
Data correspond to usage on the plateform after 2015. The current usage metrics is available 48-96 hours after online publication and is updated daily on week days.
Initial download of the metrics may take a while.