Fig. A.1.
Download original image
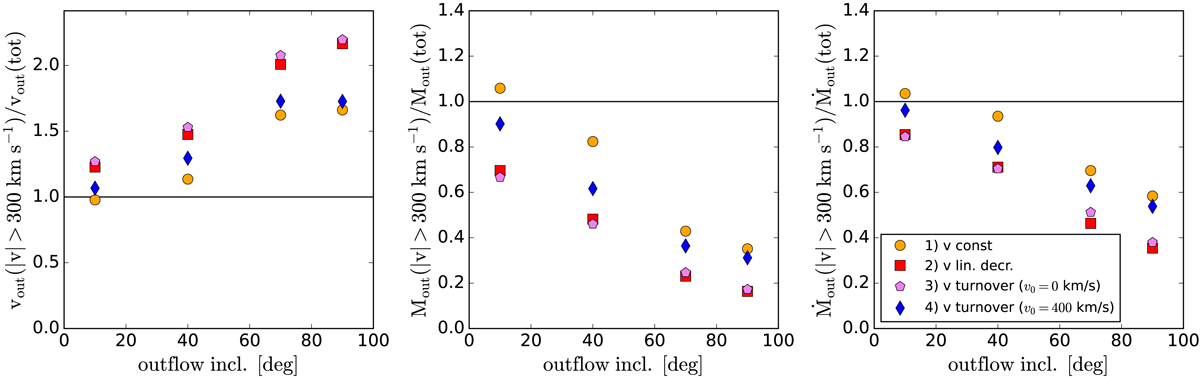
Ratios of the outflow properties (vout, Mout and Ṁout) measured with our method from the total profile (systemic+outflow) considering only the |v|> 300 km s−1 range and from only the outflow profile considering the full velocity range. The ratios are shown as a function of the outflow inclination with respect to our line of sight (where i = 90° is in the plane of the sky). The points are colour-coded according to outflow velocity radial distribution used in the simulation. The black lines show the one-to-one ratio.
Current usage metrics show cumulative count of Article Views (full-text article views including HTML views, PDF and ePub downloads, according to the available data) and Abstracts Views on Vision4Press platform.
Data correspond to usage on the plateform after 2015. The current usage metrics is available 48-96 hours after online publication and is updated daily on week days.
Initial download of the metrics may take a while.