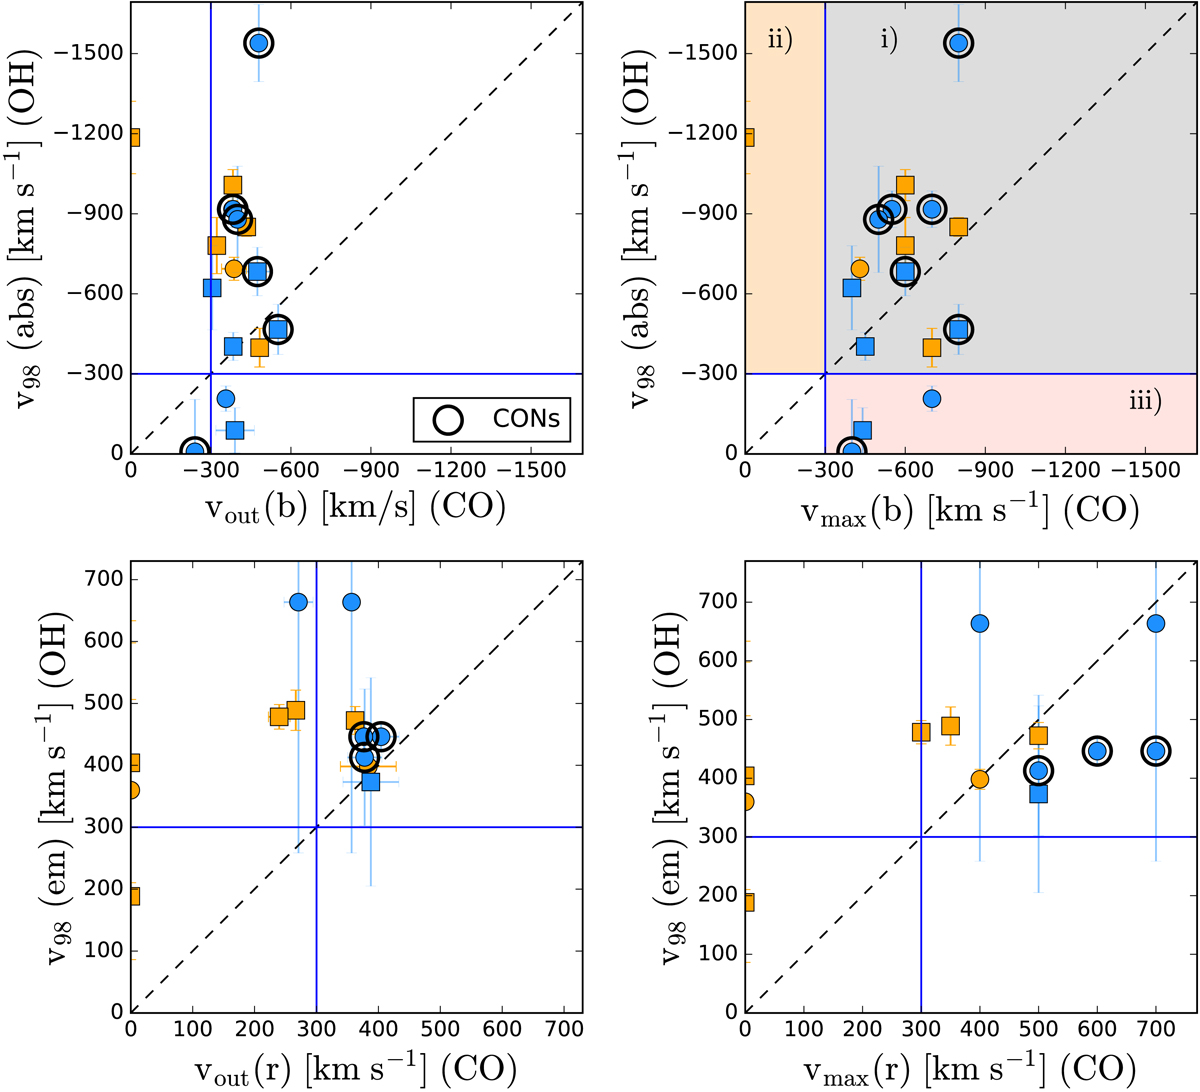
Fig. 22.
Download original image
Comparison of the outflow velocities of OH and CO. Upper row: v98 derived from the OH absorption profile compared with the mean (vout(b), left) and maximum (vmax(b), right) velocities of the CO blue-shifted wing. The background colours highlight the three regions described in Sect. 5.4: (i) targets with v98 similar to vmax(b), (ii) targets with v98 > vmax(b), and (iii) targets v84 < vmax(b). Lower row: v98 derived from the OH emission profile compared with the mean (vout(r), left) and maximum (vmax(r), right) velocities of the CO red-shifted wing. The blue lines mark the outflow detection threshold of |v|> 300 km s−1. Black circles mark targets classified as compact obscured nuclei (CONs). Colour-code as in Fig. 1.
Current usage metrics show cumulative count of Article Views (full-text article views including HTML views, PDF and ePub downloads, according to the available data) and Abstracts Views on Vision4Press platform.
Data correspond to usage on the plateform after 2015. The current usage metrics is available 48-96 hours after online publication and is updated daily on week days.
Initial download of the metrics may take a while.