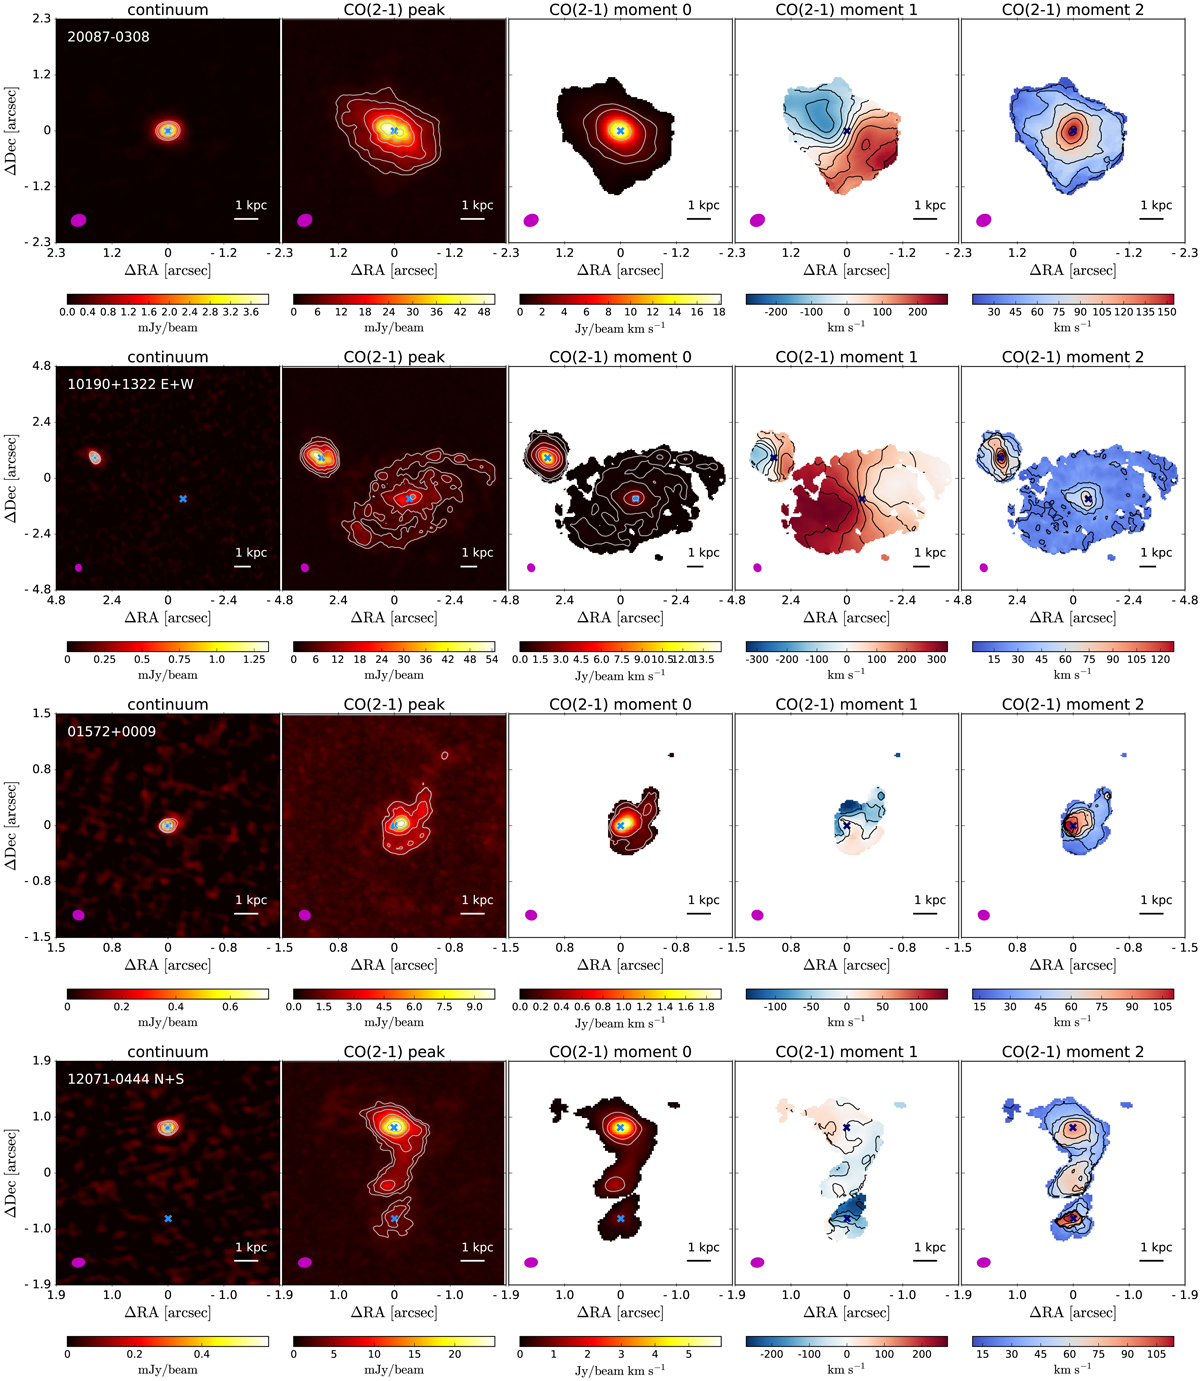
Fig. 2.
Download original image
Examples of the ALMA ∼220 − 250 GHz continuum and CO(2–1) moment maps (from left to right: peak map, moment 0, 1, and 2) for a merger (20087−0308) and an interacting (10190+1322) starburst-dominated system and for a merger (01572+0009) and an interacting (12071−0444) AGN-dominated system. The blue crosses mark the position of the nuclei (see Table 1). The magenta ellipse shows the FWHM and position angle of the ALMA beam . The contours in the maps are: continuum map: [0.3, 0.4, 0.6, 0. 8, 0.9] of the maximum; peak map: 1.5 × σ (where σ is the rms) and [0.1, 0. 2, 0.4, 0.6, 0.8] of the maximum; moment 0: [3, 6, 25, 50, 75] × σ (where σ is the rms), moment 1: every 50 km s−1 (every 25 km s−1 if the maximum value < 100 km s−1), moment 2: every 25 km s−1 (every 15 km s−1 if the maximum value < 150 km s−1).
Current usage metrics show cumulative count of Article Views (full-text article views including HTML views, PDF and ePub downloads, according to the available data) and Abstracts Views on Vision4Press platform.
Data correspond to usage on the plateform after 2015. The current usage metrics is available 48-96 hours after online publication and is updated daily on week days.
Initial download of the metrics may take a while.