Fig. 18.
Download original image
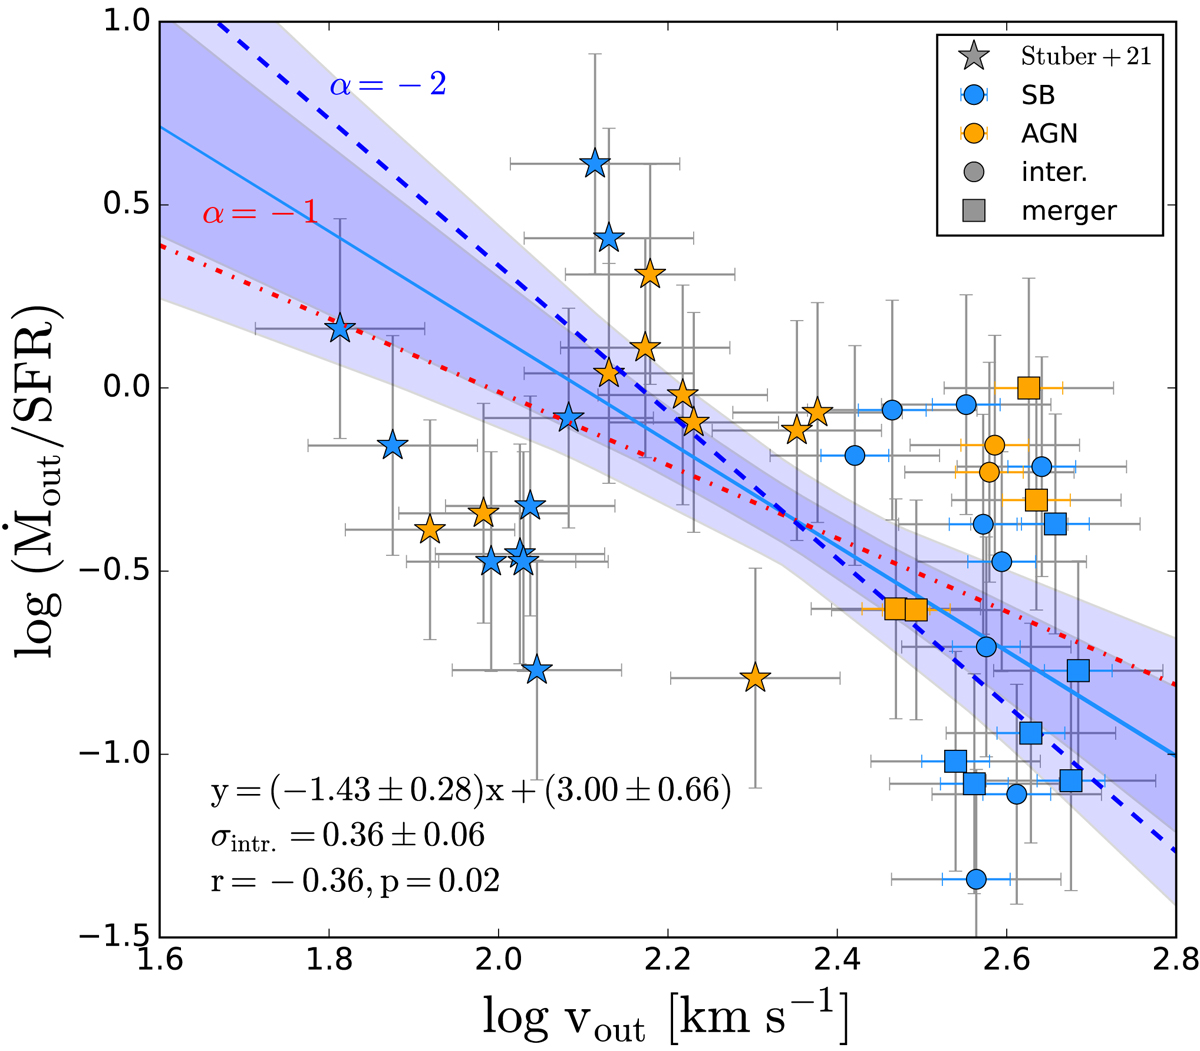
Mass-loading factor versus outflow velocity for our sample (circles and square symbols) and the PHANGS-ALMA sample (stars). The lightblue line is the best linear bisector fit to the data and the shaded areas indicates the 1σ uncertainty on the fit with and without including the intrinsic scatter term (lighter and darker colour, respectively). The blue dashed line shows the predictions for a energy-driven outflow (α = −2) and the red dotted-dashed line for a momentum-driven outflow (α = −1).
Current usage metrics show cumulative count of Article Views (full-text article views including HTML views, PDF and ePub downloads, according to the available data) and Abstracts Views on Vision4Press platform.
Data correspond to usage on the plateform after 2015. The current usage metrics is available 48-96 hours after online publication and is updated daily on week days.
Initial download of the metrics may take a while.