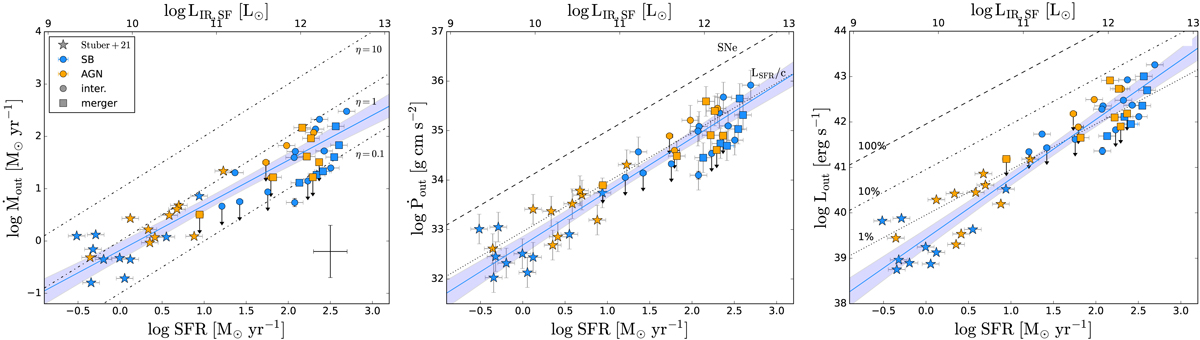
Fig. 17.
Download original image
Mass outflow rate (left), outflow momentum rate (middle), and outflow kinetic luminosity (right) as a function of SFR. Lightblue and orange symbols indicate SB- and AGN-dominated nuclei, respectively. Circles indicate interacting systems and squares indicate mergers from the PUMA sample (including nuclei with log LIR/L⊙ < 11.8). Stars show the PHANGS-ALMA targets from Stuber et al. (2021). A representative errorbar is shown on the lower right. Left panel: the black dotted-dashed lines show lines of constant mass-loading factors (η = Ṁout/SFR) of 0.1, 1 and 10. Middle panel: the dashed line indicates the total momentum injected by SNe as a function of SFR. The dotted line shows the LSFR/c ratio, where LSFR is the IR luminosity for a given SFR derived using the Kennicutt & Evans (2012) relation. Right panel: the lines show the 1%, 10% and 100% of the energy produced by SNe. The lightblue lines in the three panels are the best linear fit to the data, with the shaded area indicating the 1σ uncertainty.
Current usage metrics show cumulative count of Article Views (full-text article views including HTML views, PDF and ePub downloads, according to the available data) and Abstracts Views on Vision4Press platform.
Data correspond to usage on the plateform after 2015. The current usage metrics is available 48-96 hours after online publication and is updated daily on week days.
Initial download of the metrics may take a while.