Fig. 16.
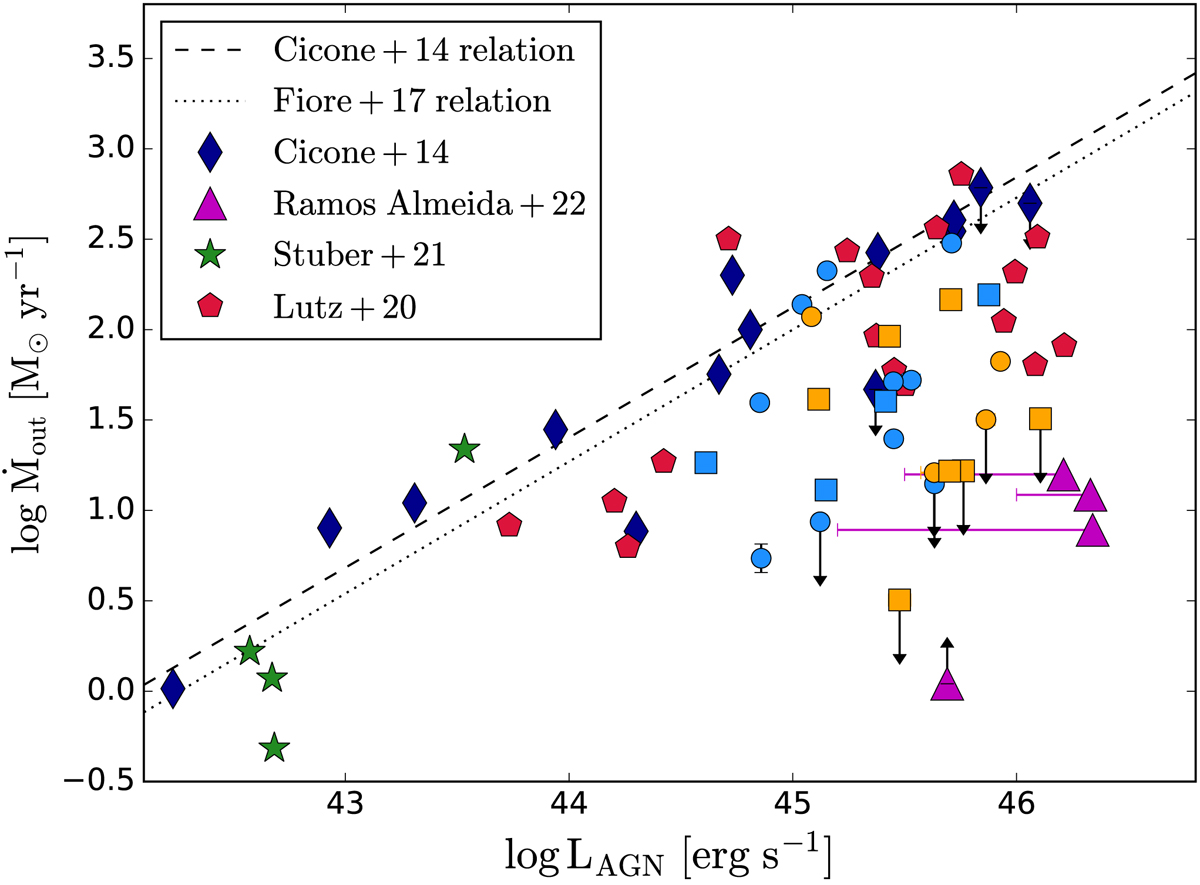
Download original image
Mass outflow rate versus AGN luminosity. Diamonds symbols show the sample from Cicone et al. (2014), for which Ṁout have been scaled down by a factor of three to match our outflow geometry definition. The sample of Ramos Almeida et al. (2022) is shown with triangles. Horizontal lines for the Ramos Almeida et al. (2022) sample indicate the position that they would occupy if we were to use the LAGN derived from SED fitting from Jarvis et al. (2019), instead of the one derived from the [O III] luminosity (see Ramos Almeida et al. 2022, for details). The Lutz et al. (2020) sample is shown with red pentagons. For the Stuber et al. (2021) sample (stars), the AGN luminosities have been derived from the 14–195 keV X-ray luminosity. Symbols for the PUMA sample are as in Fig. 1. The dashed and dotted lines show the relations presented by Cicone et al. (2014) and by Fiore et al. (2017), respectively, scaled down by a factor of three to match our outflow geometry definition.
Current usage metrics show cumulative count of Article Views (full-text article views including HTML views, PDF and ePub downloads, according to the available data) and Abstracts Views on Vision4Press platform.
Data correspond to usage on the plateform after 2015. The current usage metrics is available 48-96 hours after online publication and is updated daily on week days.
Initial download of the metrics may take a while.