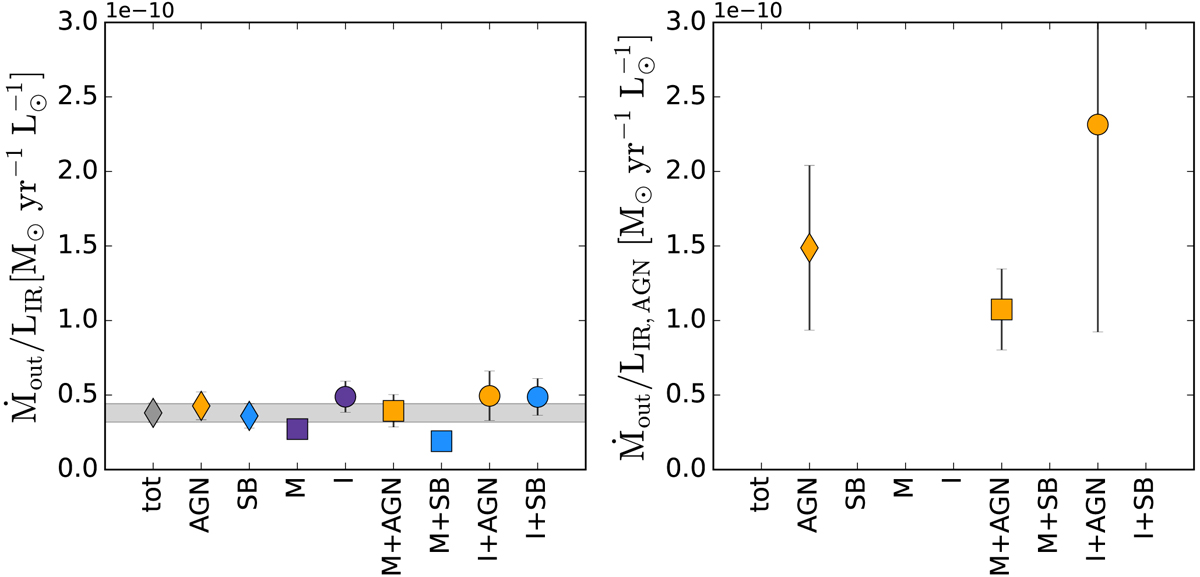
Fig. 14.
Download original image
Left: mean values of the ratio of Ṁout and total LIR for different categories: AGN, starbursts (SB), mergers (M), interacting (I), and the mix categories mergers AGN, mergers SB, interacting AGN and interacting SB. The errorbars show the uncertainty on the mean. The grey diamond and horizontal band shows the mean of the total sample and the corresponding uncertainty. Right: for the AGN categories, mean ratios of Ṁout and LIR, AGN.
Current usage metrics show cumulative count of Article Views (full-text article views including HTML views, PDF and ePub downloads, according to the available data) and Abstracts Views on Vision4Press platform.
Data correspond to usage on the plateform after 2015. The current usage metrics is available 48-96 hours after online publication and is updated daily on week days.
Initial download of the metrics may take a while.