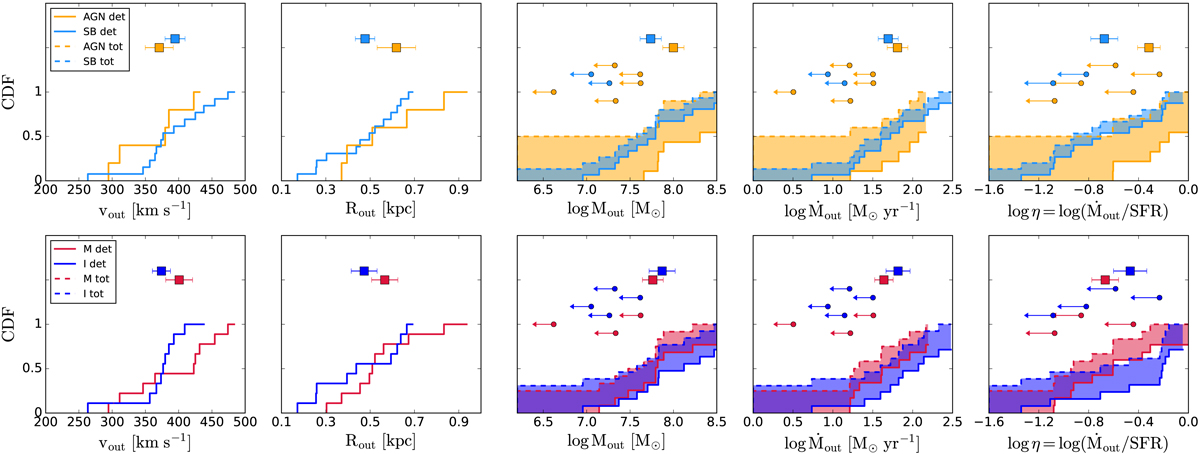
Fig. 13.
Download original image
Cumulative distribution function (CDF) of the outflow properties of AGN and starbursts (SB, top) and mergers (M) and interacting (I, bottom). The solid lines show the CDFs for the outflow detections only, while the dashed lines show the CDFs including upper limits (only for Mout, Ṁout and η). The shaded area mark the area between the CDFs with and without upper limits. The square symbols show the average values for the outflow detections in the two categories, the points with arrows show the upper limits (with arbitrary values on the y-axis). According to a survival analysis Two Sample test, the differences between AGN and SB and between interacting and mergers, are not statistically significant.
Current usage metrics show cumulative count of Article Views (full-text article views including HTML views, PDF and ePub downloads, according to the available data) and Abstracts Views on Vision4Press platform.
Data correspond to usage on the plateform after 2015. The current usage metrics is available 48-96 hours after online publication and is updated daily on week days.
Initial download of the metrics may take a while.