Fig. 12.
Download original image
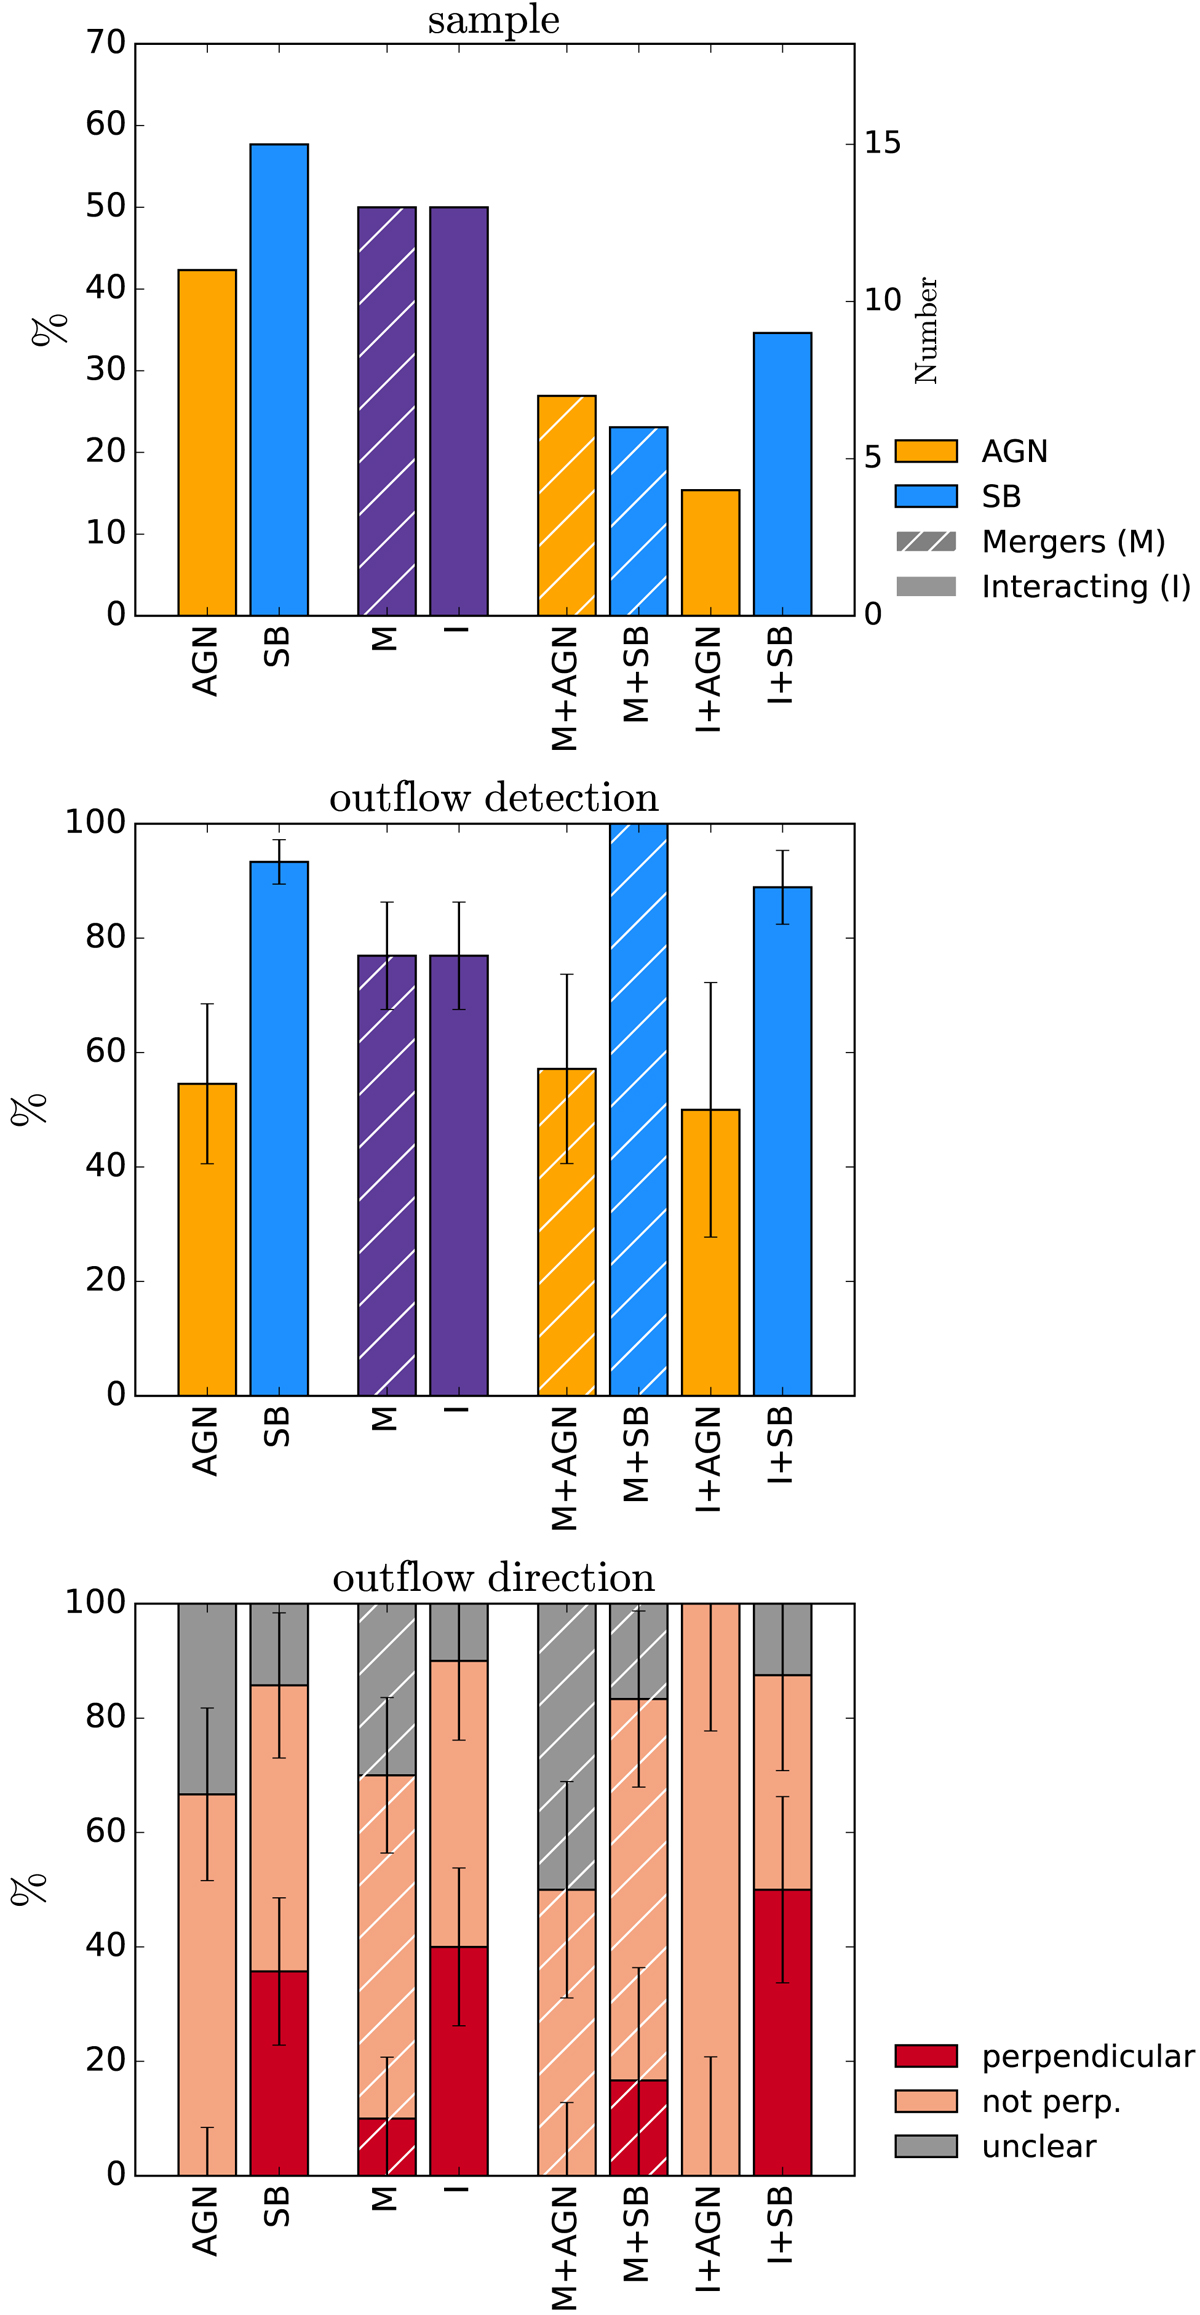
Outflow detection statistics for different categories: AGN, starburst (SB), mergers (M, dnuclei < 1 kpc), interacting systems (I, dnuclei > 1 kpc), and mixed categories (mergers AGN, mergers SB, interacting AGN, interacting SB). Upper panel: fraction of individual galaxy nuclei in each category with respect to the total sample. The scale on the right axis shows the number of objects. Middle panel: outflow detections fractions. The percentages have been calculated with respect to the total number of nuclei in each category. Lower panel: outflow orientation statistics divided in three groups: outflow projected orientation perpendicular to the kinematic major axis of the disk (angle 90 ± 20°), outflow projected orientation non-perpendicular, or orientation could not be determined. The percentages have been calculated with respect to the number of outflow detection in each category. Error bars in middle and lower panel show the 90% binomial confidence interval.
Current usage metrics show cumulative count of Article Views (full-text article views including HTML views, PDF and ePub downloads, according to the available data) and Abstracts Views on Vision4Press platform.
Data correspond to usage on the plateform after 2015. The current usage metrics is available 48-96 hours after online publication and is updated daily on week days.
Initial download of the metrics may take a while.