Fig. 11.

Download original image
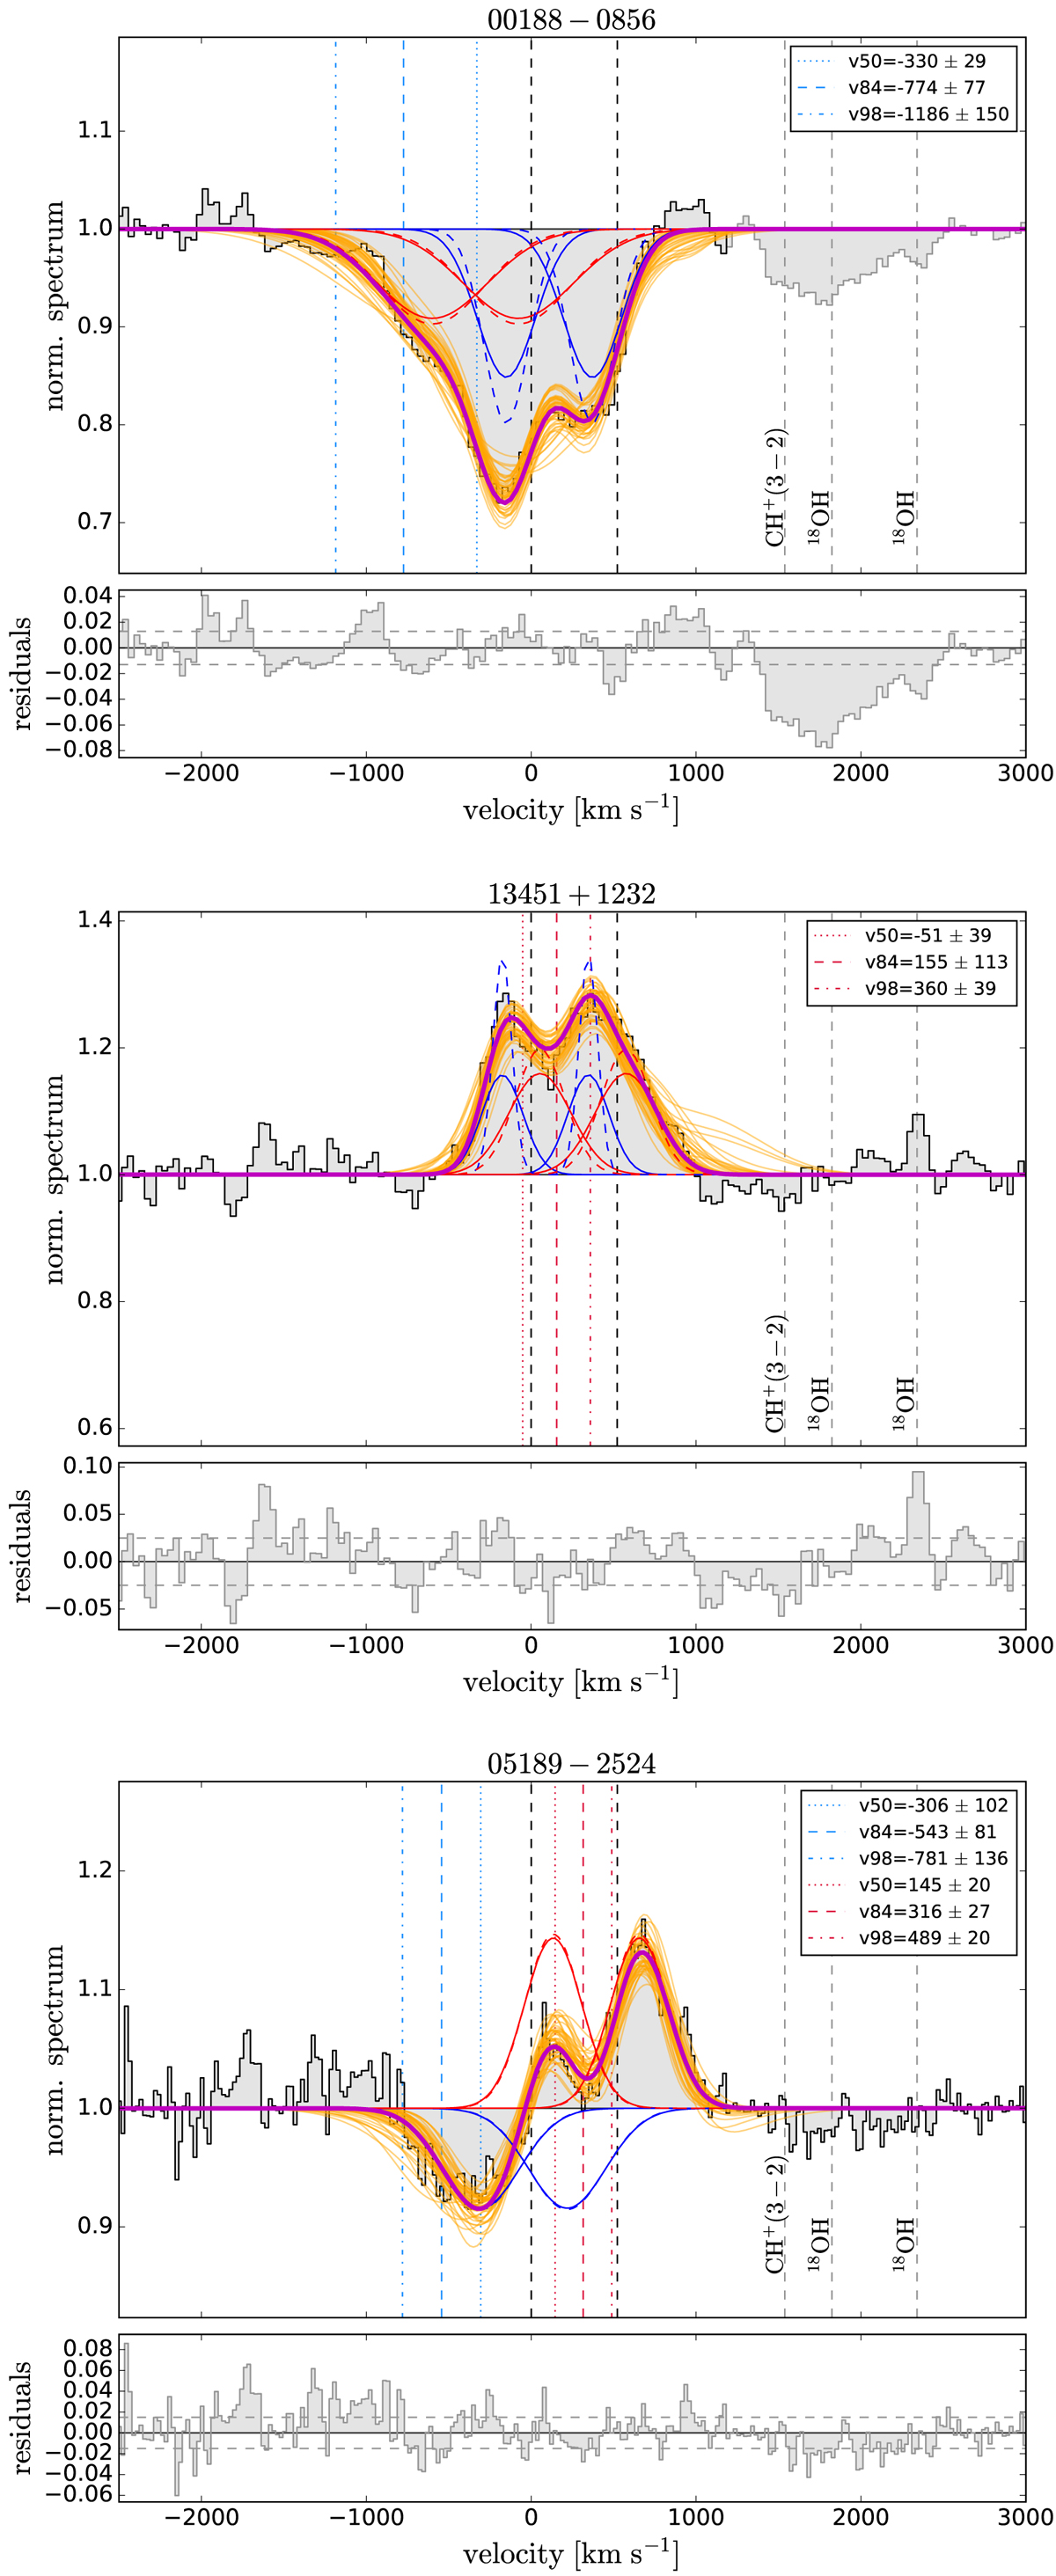
Example of the fit of the OH 119 μm doublet with absorption (upper), emission (middle) and P-Cygni (bottom) profile. The velocity is relative to the blue component of the doublet (at 119.233 μm) at the systemic velocity inferred from the CO(2–1) line. The best-fit model is shown in magenta, while the orange models are the results of the 50 Monte Carlo realisations that illustrate the uncertainty of the fit. Solid lines show the model convolved with the instrumental resolution, while dashed lines indicate the intrinsic (deconvolved) model. Blue and red mark the two components of the fit. The vertical dotted, dashed and dot-dashed lines show the v50, v84 and v98 percentile velocities, respectively, derived from the absorption (blue) and/or emission (red) profiles. Grey dashed lines at ∼2000 km s−1 show the position of the 18OH 120 μm doublet and the CH+(3-2) absorption line.
Current usage metrics show cumulative count of Article Views (full-text article views including HTML views, PDF and ePub downloads, according to the available data) and Abstracts Views on Vision4Press platform.
Data correspond to usage on the plateform after 2015. The current usage metrics is available 48-96 hours after online publication and is updated daily on week days.
Initial download of the metrics may take a while.


