Fig. 10.
Download original image
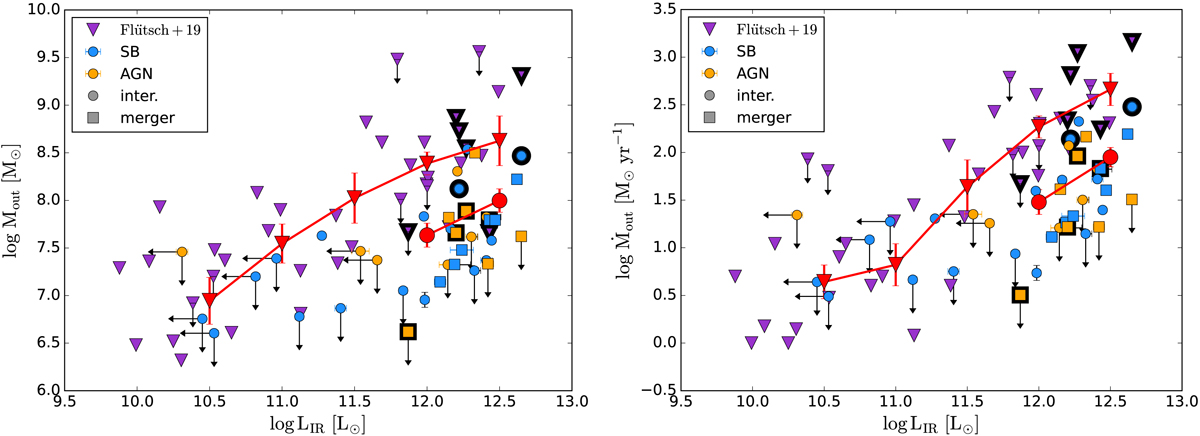
Comparison of the outflow mass and mass outflow rate as a function of IR luminosity for our sample and the sample from Fluetsch et al. (2019, purple triangles). The red symbols show the average values (considering only the detections) in bins of log LIR for the Fluetsch et al. (2019) sample (triangles) and the PUMA sample (circles). The sources in common between the two samples are highlighted with black contours. Due to the different methods, the Mout and Ṁout values estimated by Fluetsch et al. (2019) are higher by a factor of ×5 − 8 compared with our measurements at the same infrared luminosity.
Current usage metrics show cumulative count of Article Views (full-text article views including HTML views, PDF and ePub downloads, according to the available data) and Abstracts Views on Vision4Press platform.
Data correspond to usage on the plateform after 2015. The current usage metrics is available 48-96 hours after online publication and is updated daily on week days.
Initial download of the metrics may take a while.