Fig. 9.
Download original image
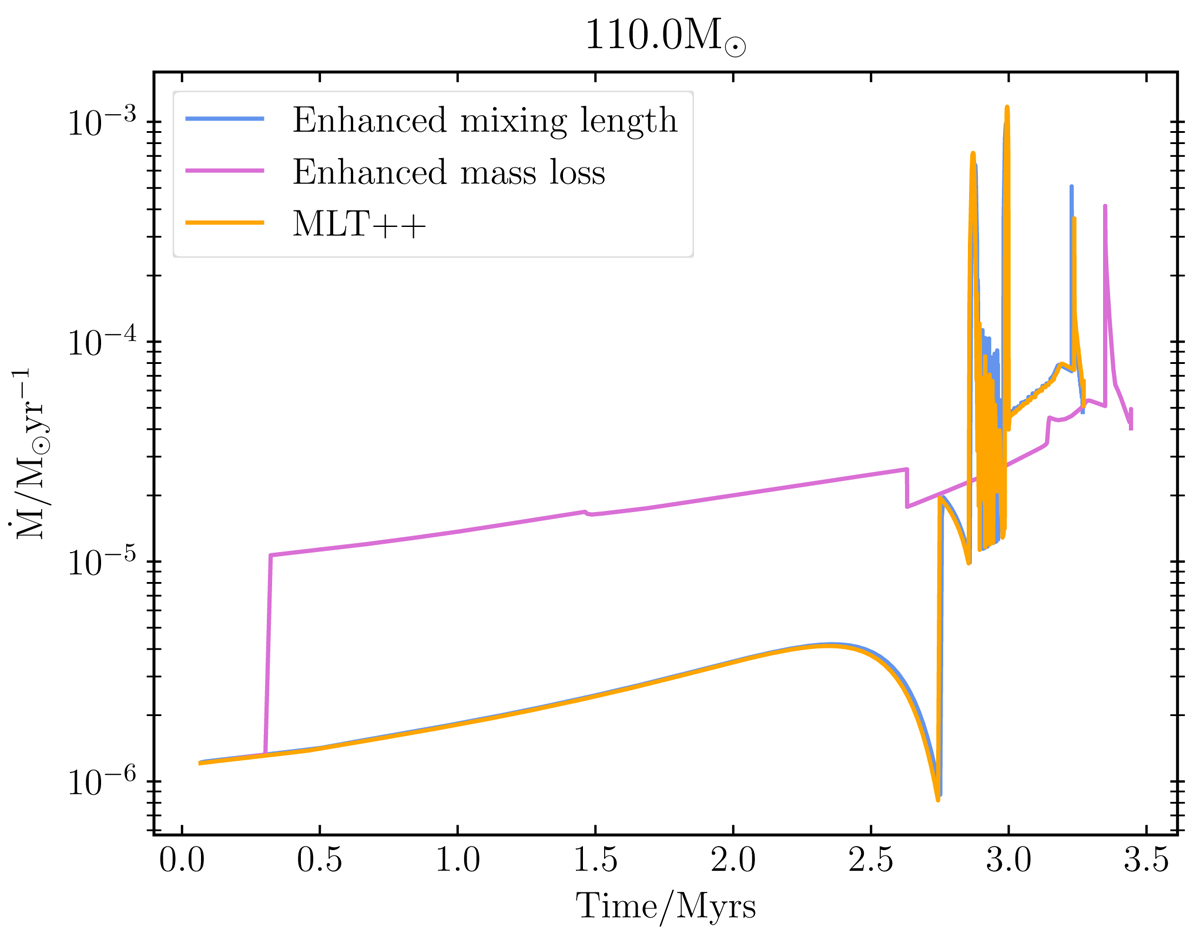
Variation in mass-loss rates with time for a 110 M⊙ star evolved with enhanced mixing length (blue line), enhanced mass loss (pink line) and with MLT++ (orange line). While the maximum mass-loss rate encountered by the 110 M⊙ model with enhanced mass loss is less than the maximum mass-loss rate encountered by the models evolved with the other two solutions, it still ends up being the least massive of all in the end. See Sect. 5.1 for an explanation.
Current usage metrics show cumulative count of Article Views (full-text article views including HTML views, PDF and ePub downloads, according to the available data) and Abstracts Views on Vision4Press platform.
Data correspond to usage on the plateform after 2015. The current usage metrics is available 48-96 hours after online publication and is updated daily on week days.
Initial download of the metrics may take a while.