Fig. 8.
Download original image
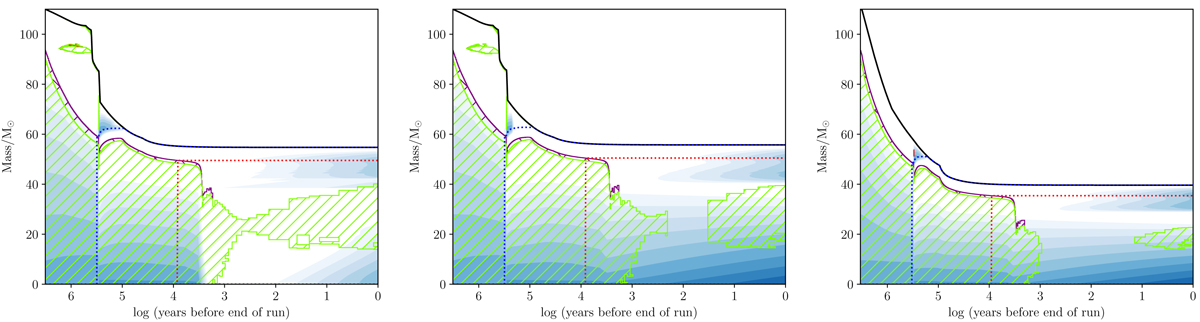
Kippenhahn plots showing the structure of a 110 M⊙ star evolved with enhanced mixing (left), with MLT++ (middle) and with enhanced mass loss (right). The Y-axis represents the mass coordinate inside the star while the X-axis represents the time remaining in the life of the star before the end of the run is reached. Green, purple and red hatching mark the regions with convection, overshooting and semiconvective mixing, respectively. In all three panels, the helium core boundary is the outermost location where the hydrogen mass fraction is < 0.01, while the helium mass fraction is ≥0.01, and is represented by the blue dashed line. Similarly, the carbon core boundary is defined as the outermost location where the hydrogen and helium mass fraction are < 0.01 while the carbon mass fraction is ≥0.01. It is represented as the red dashed line.
Current usage metrics show cumulative count of Article Views (full-text article views including HTML views, PDF and ePub downloads, according to the available data) and Abstracts Views on Vision4Press platform.
Data correspond to usage on the plateform after 2015. The current usage metrics is available 48-96 hours after online publication and is updated daily on week days.
Initial download of the metrics may take a while.