Fig. 7.
Download original image
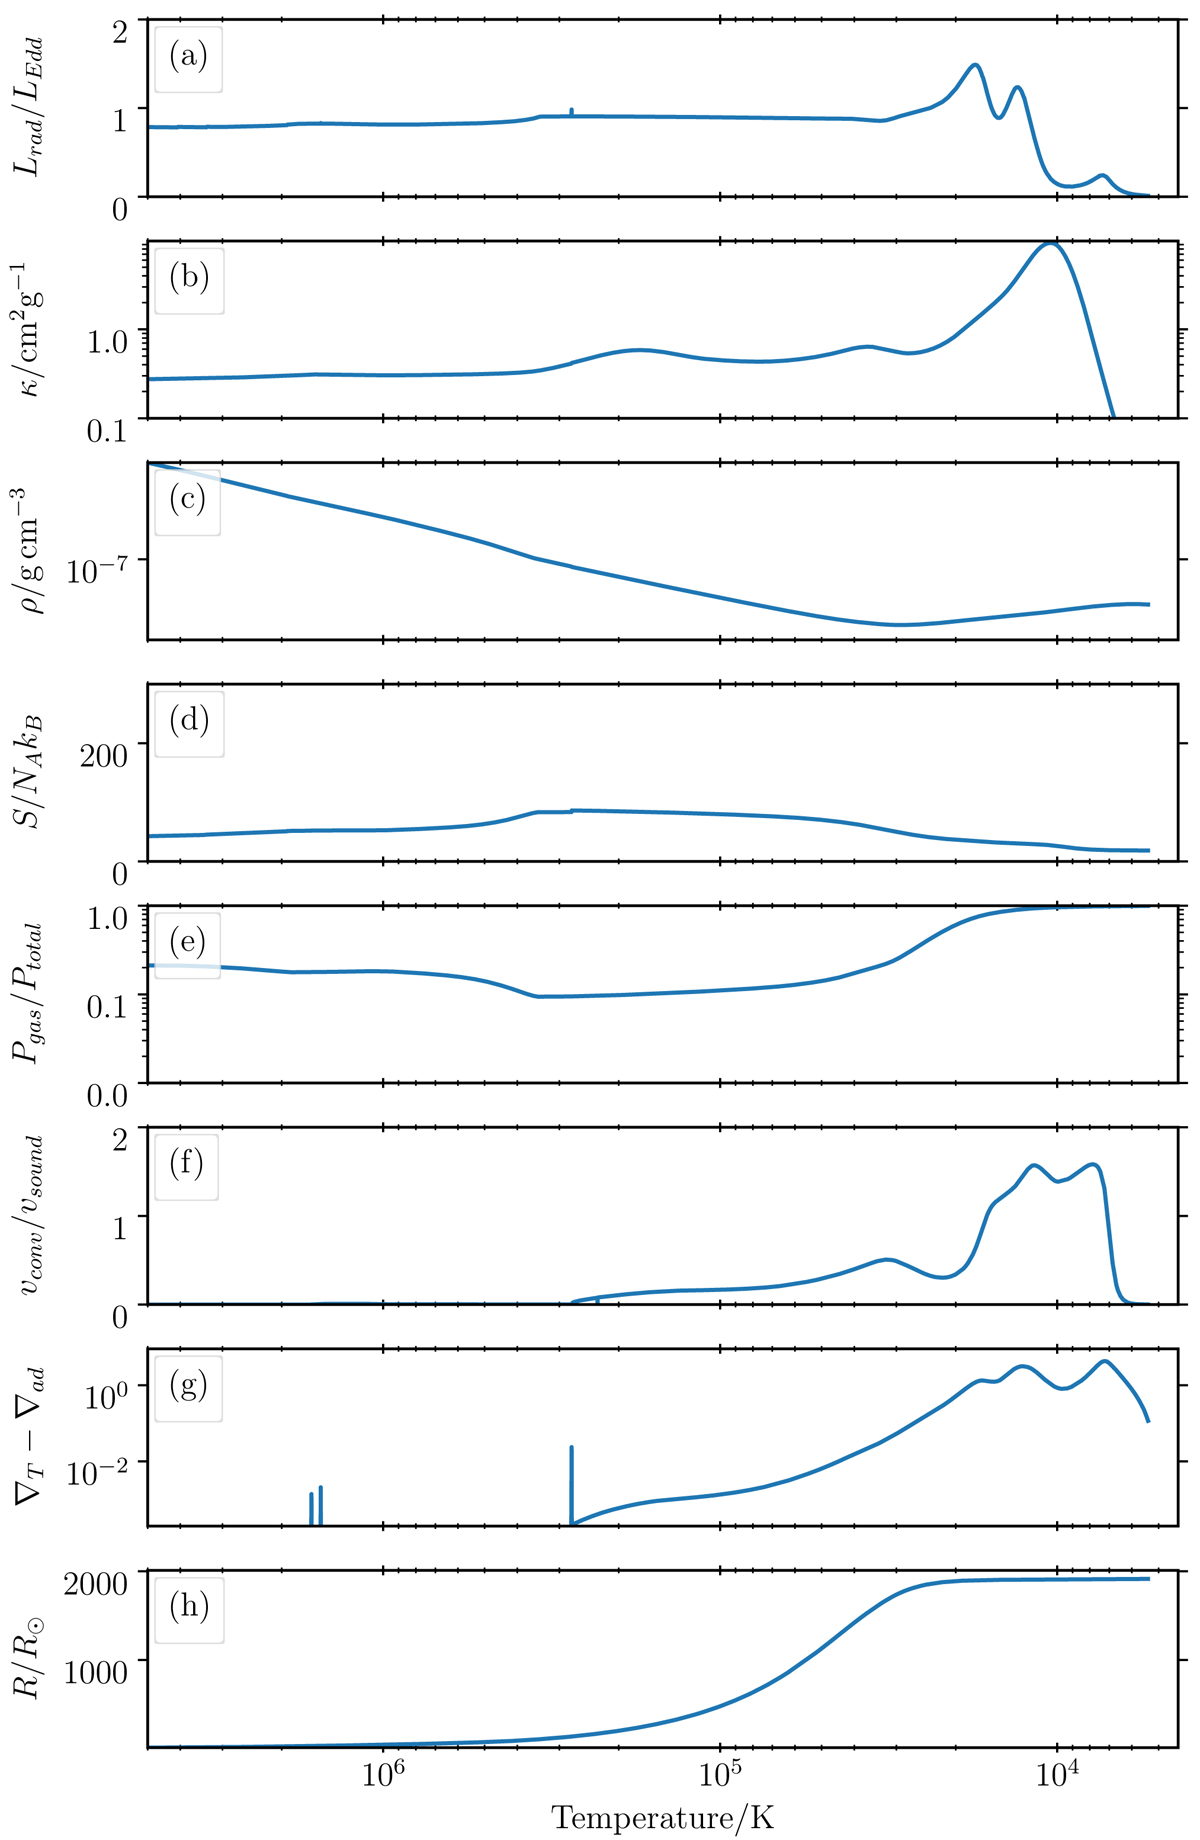
Temperature profile of the outermost layers of a 110 M⊙ star computed with the MLT++ method of MESA. The method artificially reduces the difference between ∇T and ∇ad in the stellar envelope, acting as an source of additional envelope mixing (see Sect. 4.3 for details). The small envelope mixing used here is not enough to suppress density inversions completely (panel c) but it does help to keep the specific entropy small (panel d), gas pressure fraction non-negligible (panel e) and therefore time steps reasonable.
Current usage metrics show cumulative count of Article Views (full-text article views including HTML views, PDF and ePub downloads, according to the available data) and Abstracts Views on Vision4Press platform.
Data correspond to usage on the plateform after 2015. The current usage metrics is available 48-96 hours after online publication and is updated daily on week days.
Initial download of the metrics may take a while.