Fig. 6.
Download original image
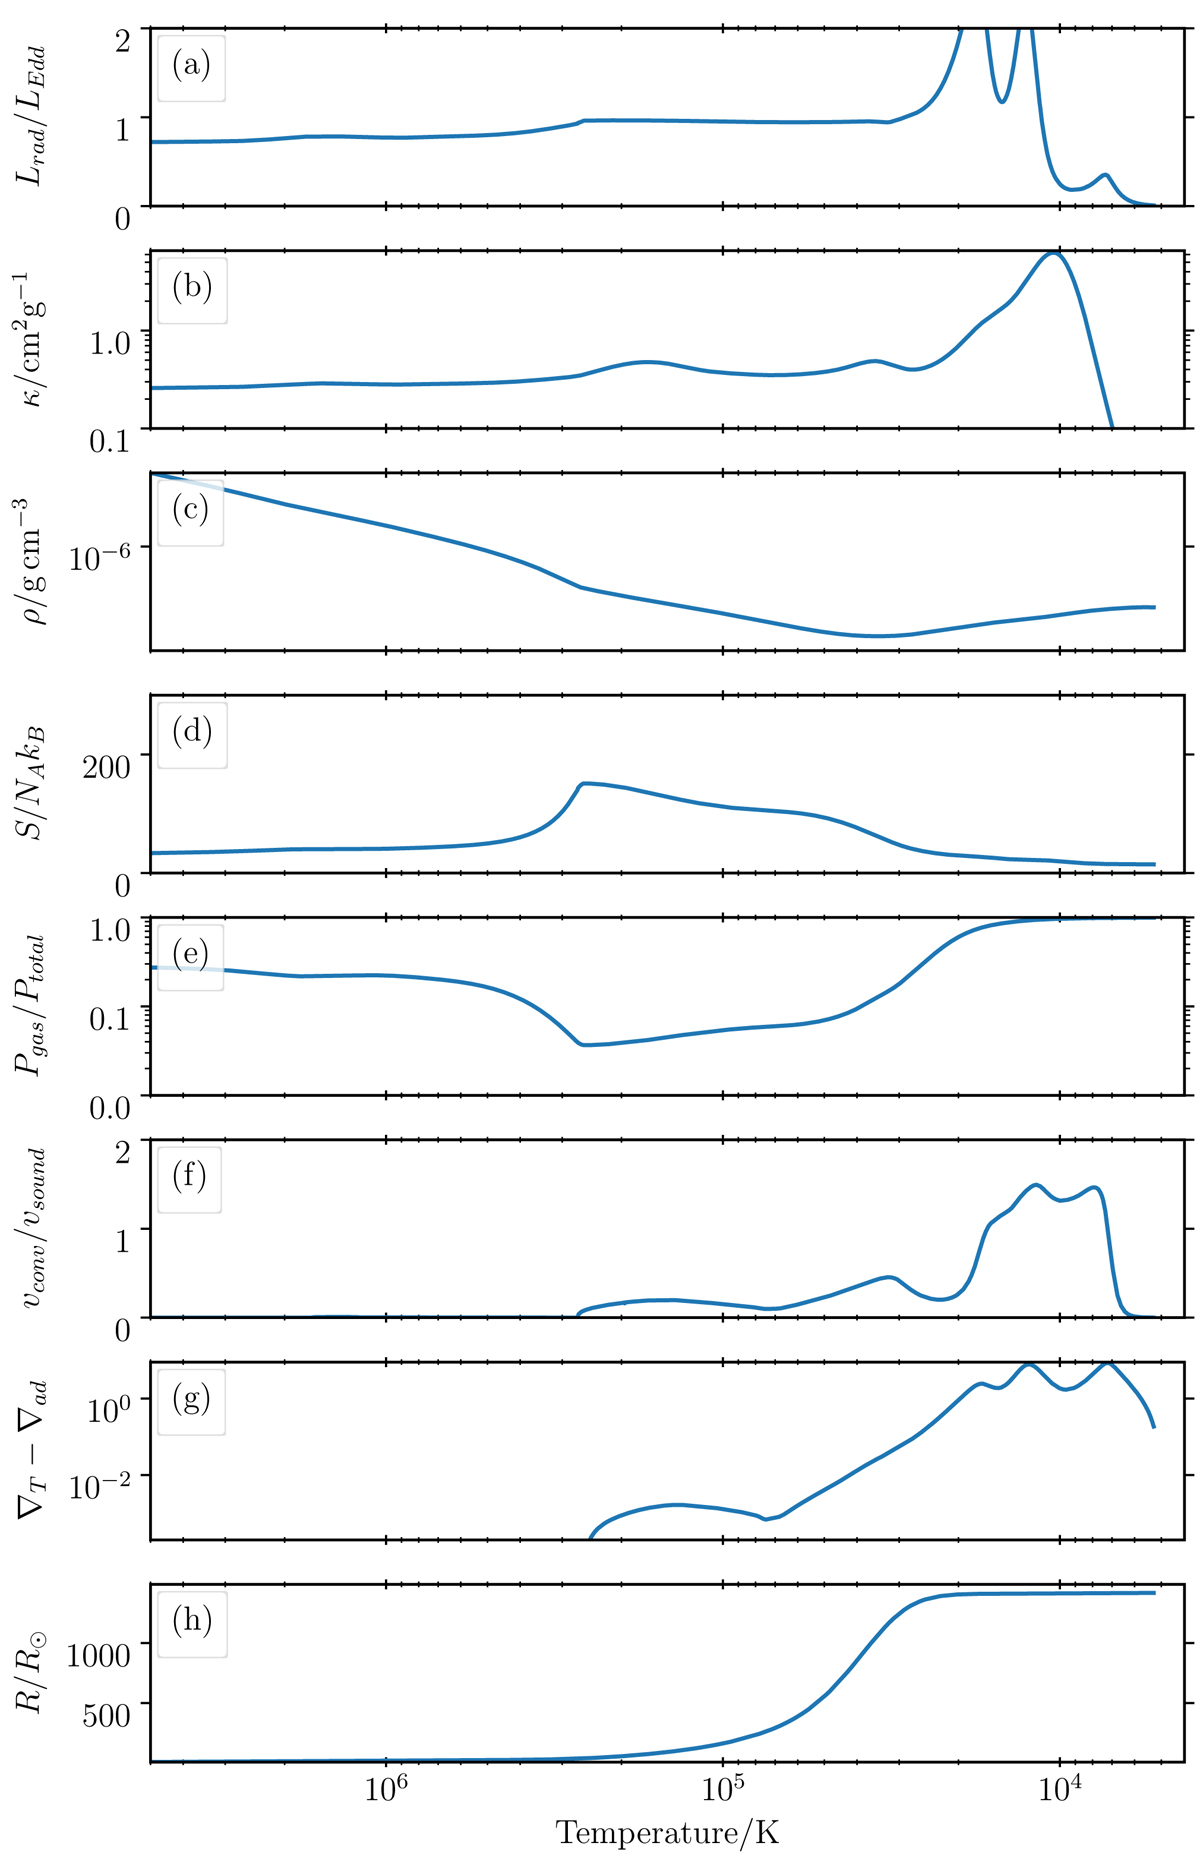
Temperature profile of the outermost layers of a 70 M⊙ star computed with enhanced mass loss, as described in Sect. 4.2. Opacity peaks due to the ionization states of hydrogen, helium and iron and associated density inversions can be seen in panel (b) and panel (c) respectively. However, high mass-loss rates remove the outer layers containing the hydrogen and helium opacity peaks, moderating the specific entropy at the base of the convective envelope and the model is able to evolve until completion with reasonably large time steps.
Current usage metrics show cumulative count of Article Views (full-text article views including HTML views, PDF and ePub downloads, according to the available data) and Abstracts Views on Vision4Press platform.
Data correspond to usage on the plateform after 2015. The current usage metrics is available 48-96 hours after online publication and is updated daily on week days.
Initial download of the metrics may take a while.