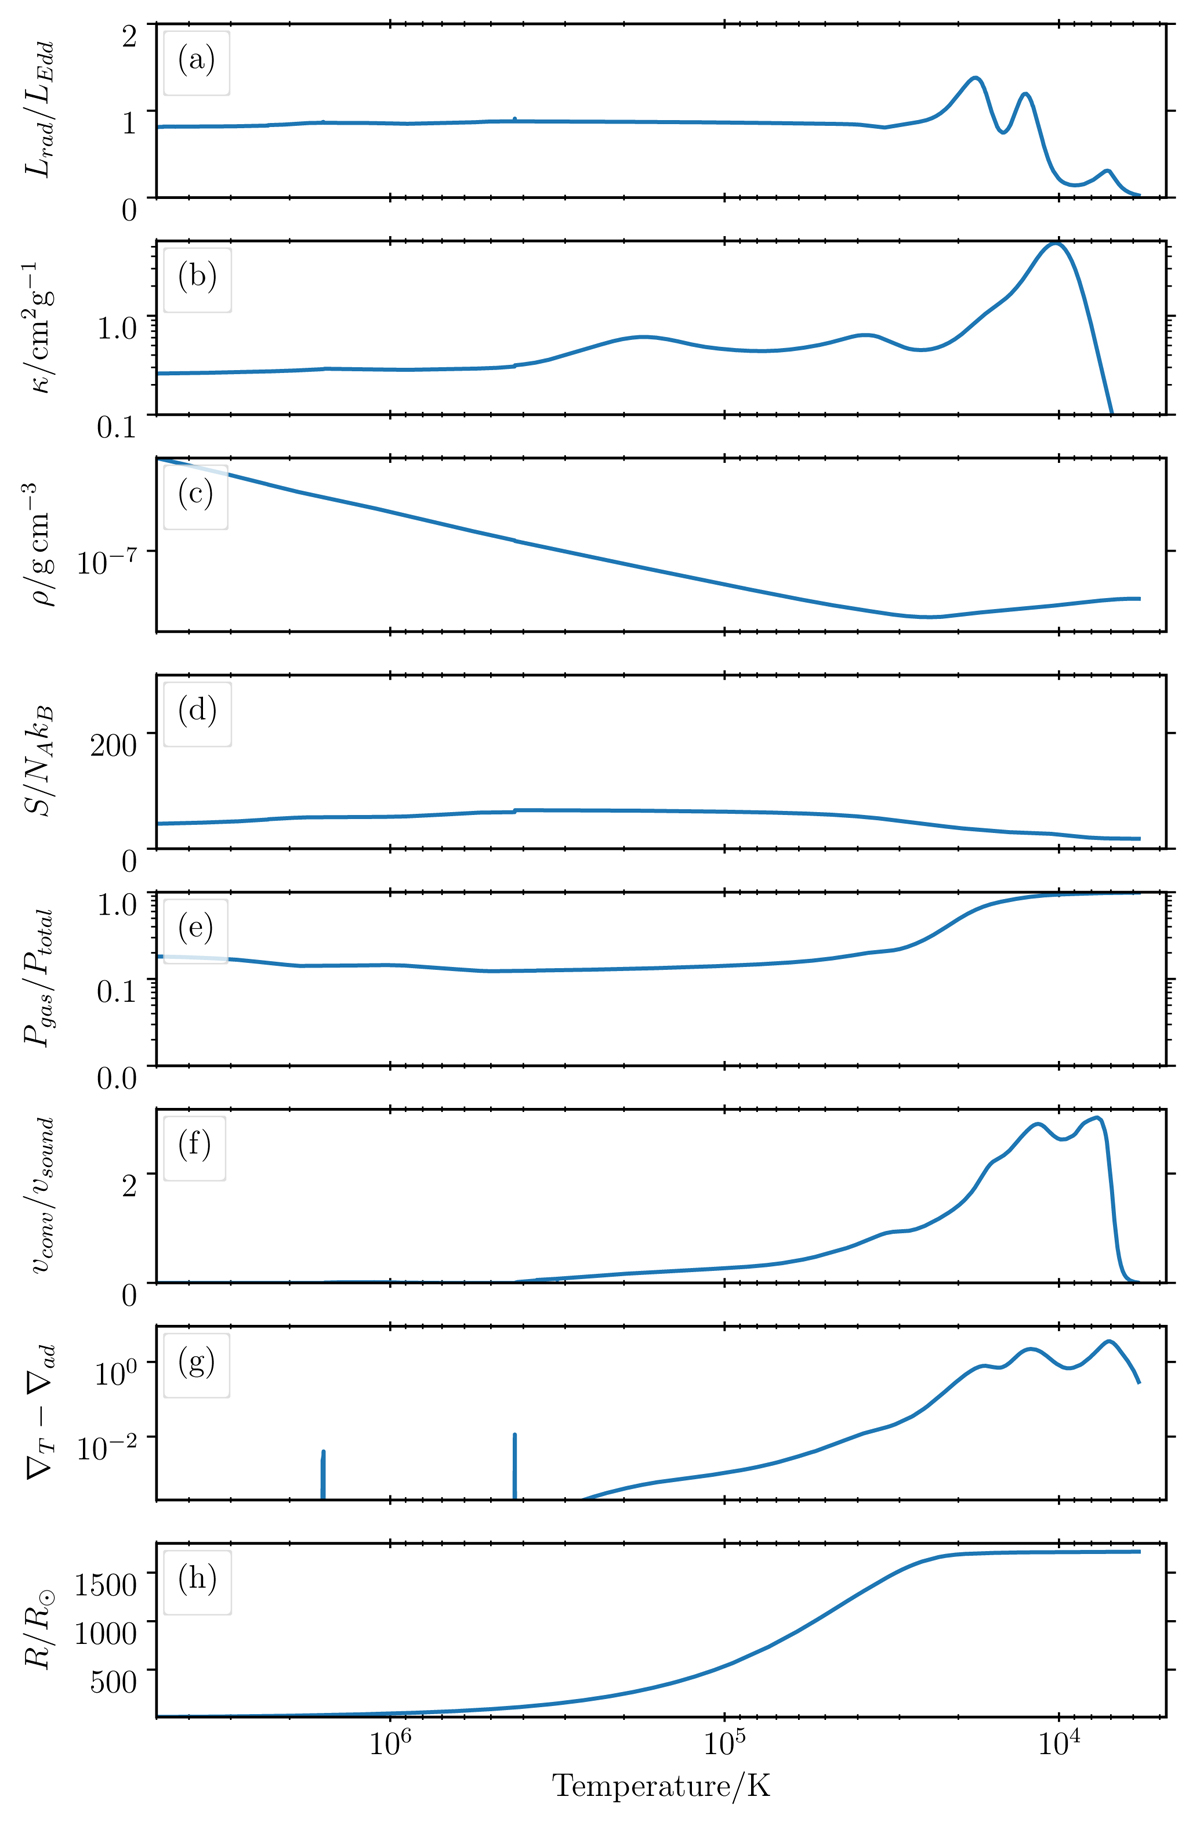
Fig. 5.
Download original image
Temperature profile of the outermost layers of a 110 M⊙ star computed with the mixing length parameter, αMLT = 5.46. Similar to Fig. 3, a density inversion can be seen in panel (c). However, higher convective velocity (panel f) and smaller superadiabaticity (panel g) resulting from the higher value of αMLT helps to keep the specific entropy small (panel d) and time steps large enough to evolve the model without numerical instabilities.
Current usage metrics show cumulative count of Article Views (full-text article views including HTML views, PDF and ePub downloads, according to the available data) and Abstracts Views on Vision4Press platform.
Data correspond to usage on the plateform after 2015. The current usage metrics is available 48-96 hours after online publication and is updated daily on week days.
Initial download of the metrics may take a while.