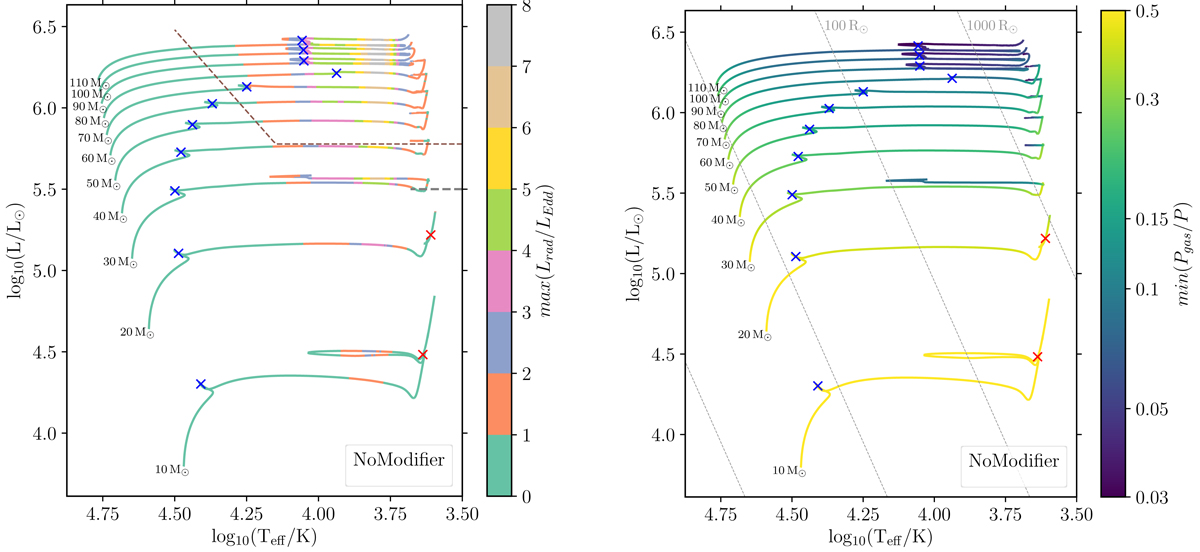
Fig. 1.
Download original image
Hertzsprung-Russell (HR) diagram showing stellar models from the standard set colored by the maximum of Lrad/LEdd (left panel) and the minimum of Pgas/Ptotal (right panel). The blue cross marks the end of core hydrogen burning and the red cross marks the end of core helium burning (where applicable). The brown dashed line in the left panel denotes the position of the observational Humphreys & Davidson (1979) limit beyond which few stars are observed, while the gray dashed line signifies the luminosities of the brightest red supergiants as inferred by Davies et al. (2018). Large values of Lrad/LEdd and small values of Pgas/Ptotal in the envelopes of stars with initial masses 30 M⊙ and above causes the evolution of these stars to become halted at log Teff/K ≈ 3.7, and their models fail to even finish core helium burning.
Current usage metrics show cumulative count of Article Views (full-text article views including HTML views, PDF and ePub downloads, according to the available data) and Abstracts Views on Vision4Press platform.
Data correspond to usage on the plateform after 2015. The current usage metrics is available 48-96 hours after online publication and is updated daily on week days.
Initial download of the metrics may take a while.