Fig. 6
Download original image
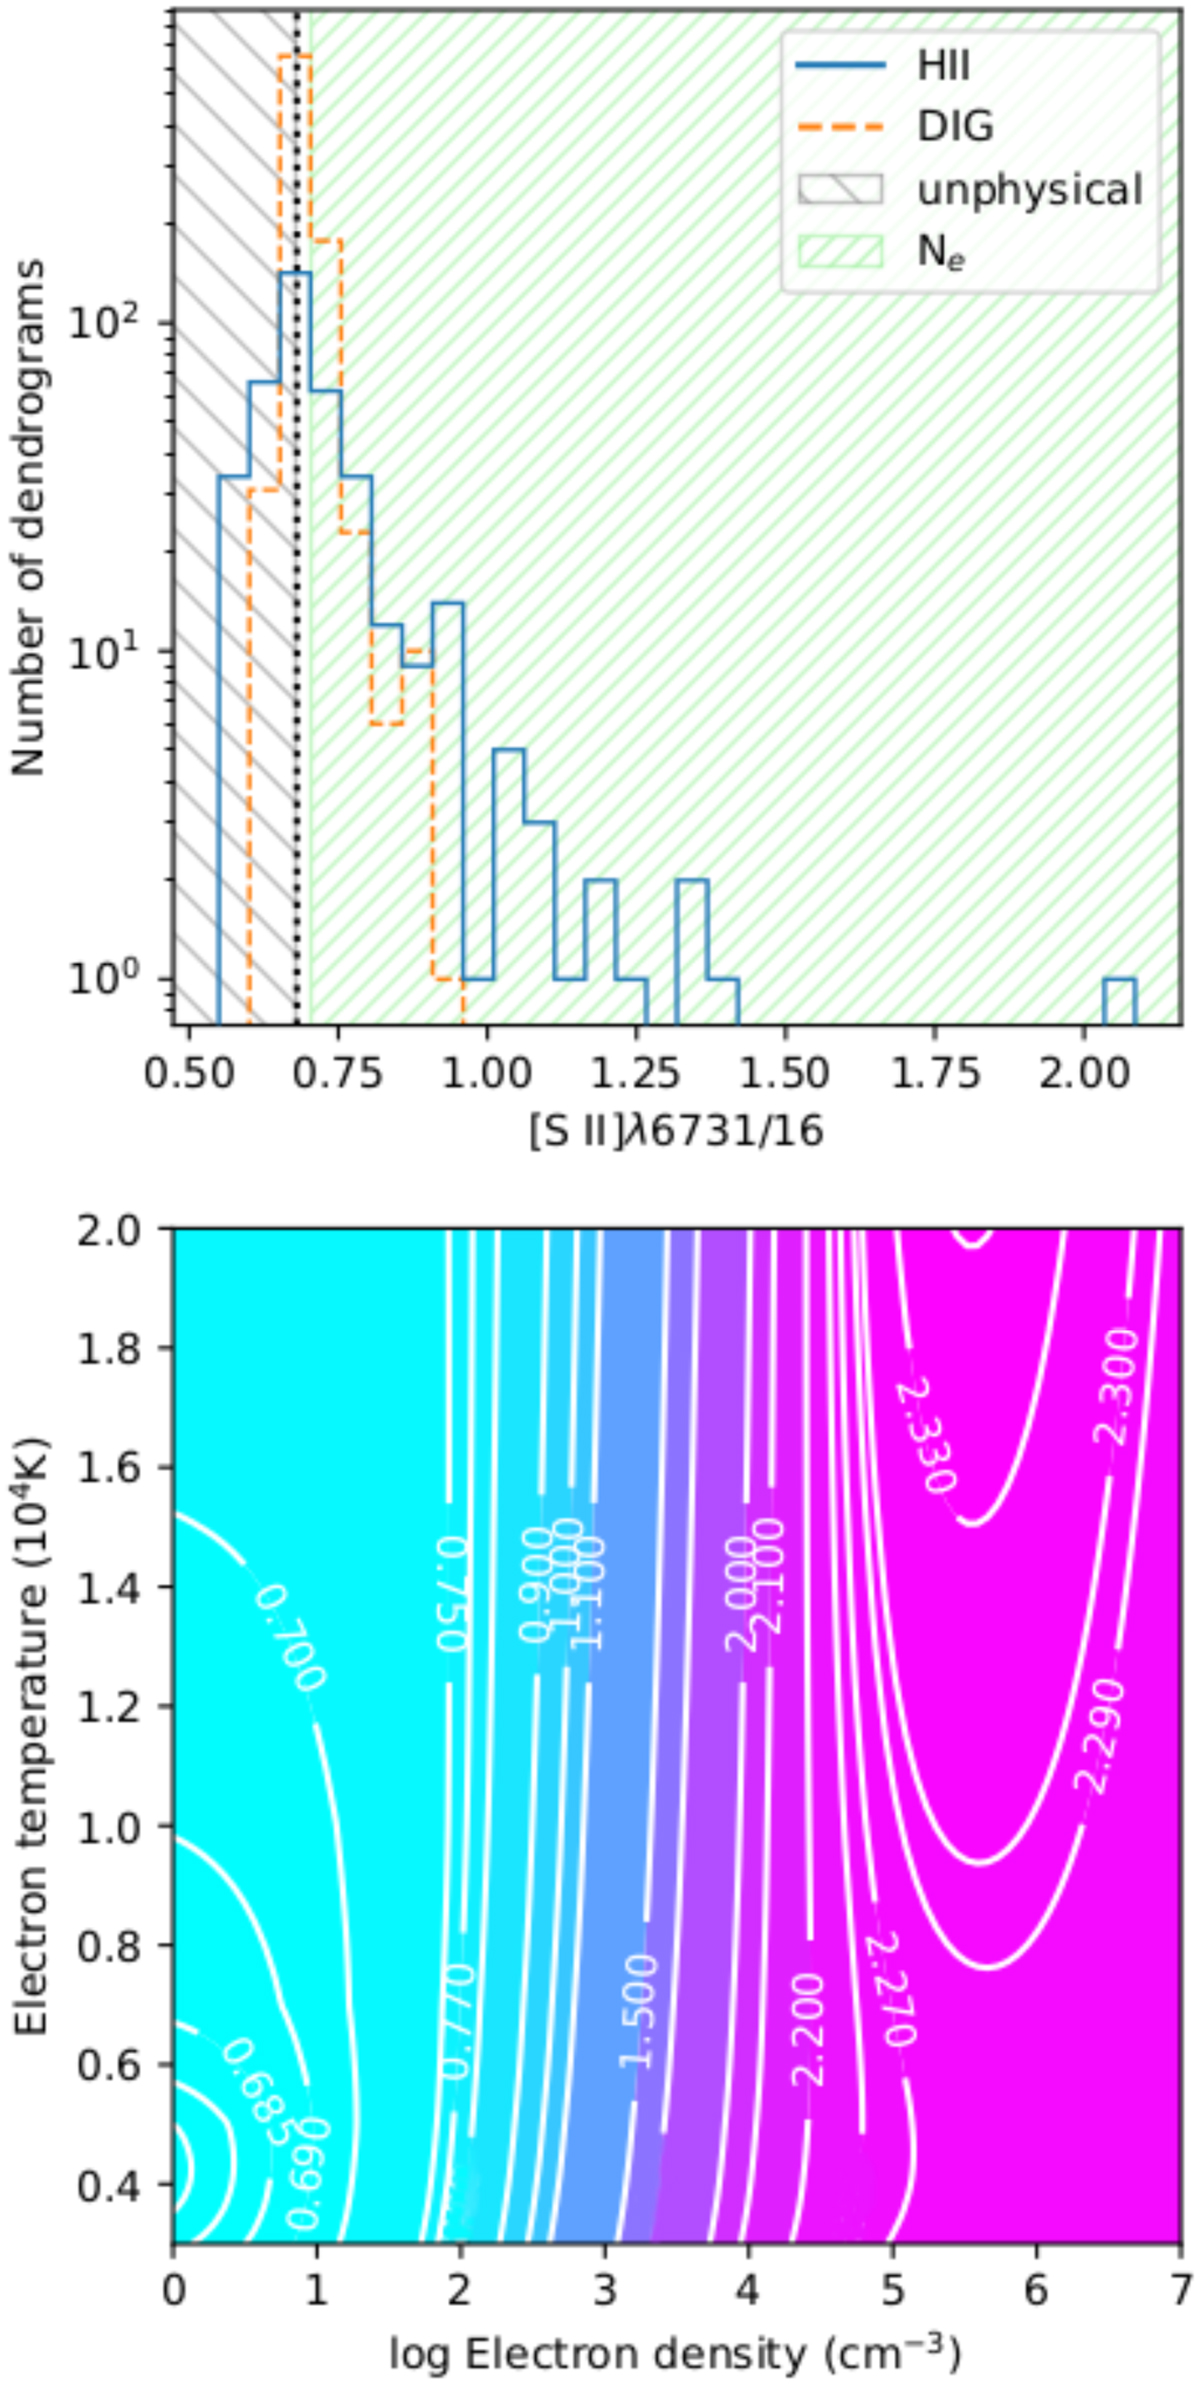
Sample electron densities. Top: histogram of the [S II]λ6731/16 ratio for H II (solid blue lines) and DIG (dashed orange lines). The area hatched with backslashes represents non-physical values, and the forward slash covers the range of Ne that is fairly invariant with Te. Bottom: [S II]λ6731/16 emissivity grid for 3kK ≤ Te ≤ 20 kK and 1 ≤ log10 Ne(cm−3) ≤ 7. Contours of [S II]λ6731/16 are overplotted in white, and the corresponding value is shown inline.
Current usage metrics show cumulative count of Article Views (full-text article views including HTML views, PDF and ePub downloads, according to the available data) and Abstracts Views on Vision4Press platform.
Data correspond to usage on the plateform after 2015. The current usage metrics is available 48-96 hours after online publication and is updated daily on week days.
Initial download of the metrics may take a while.