Fig. D.1

Download original image
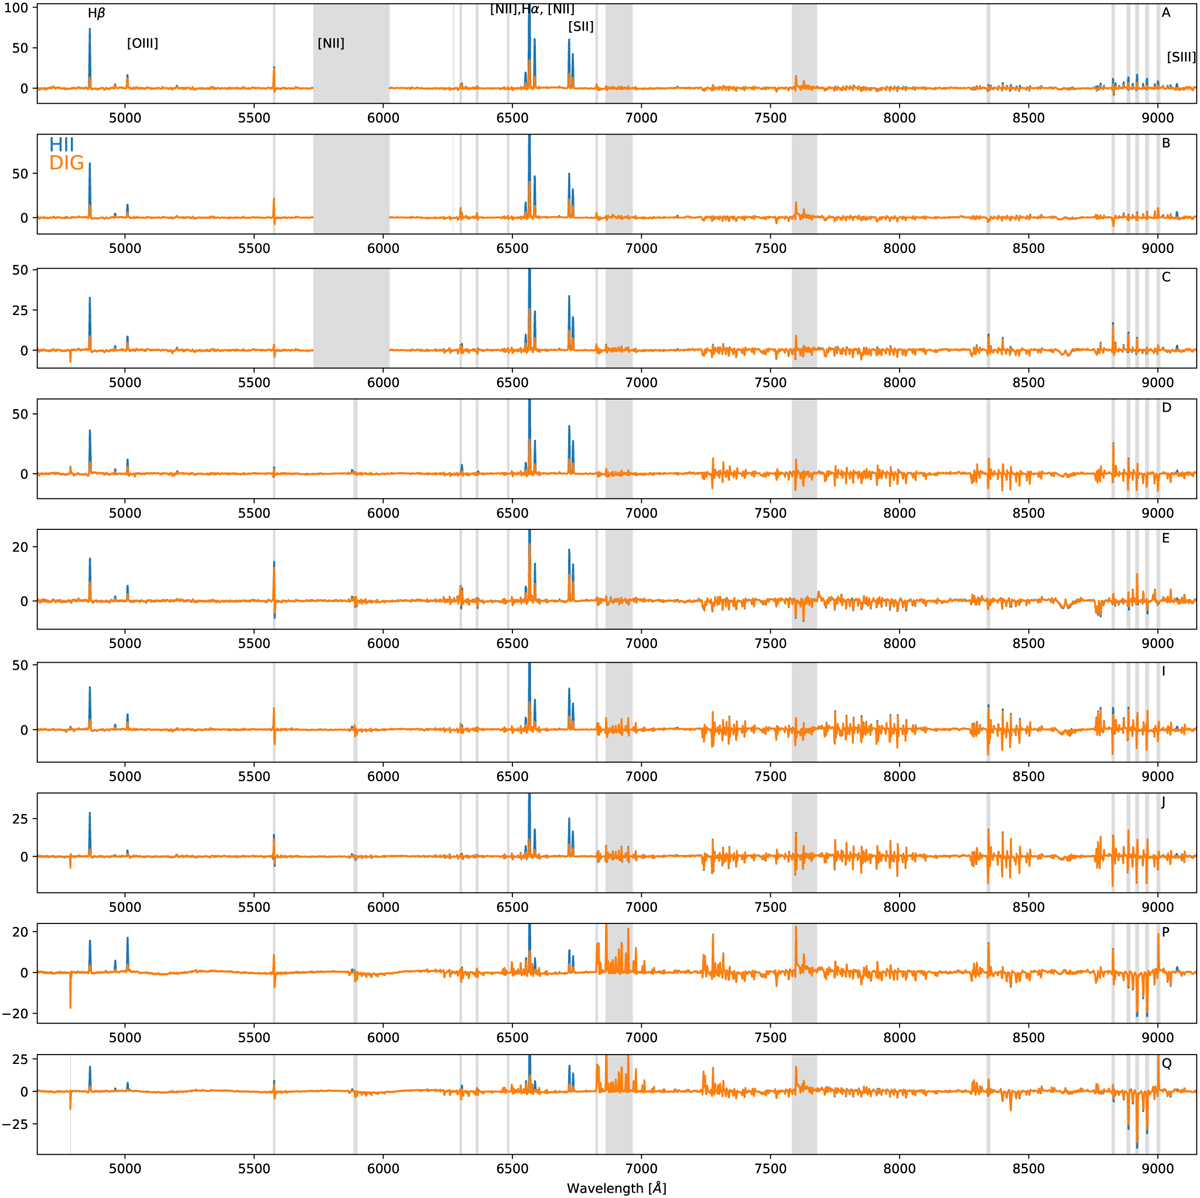
Residual average stacked spectra for H II (blue) and DIG (orange) for each field. The field is indicated in the top right corner of each panel. The main nebular emission lines that are of interest in this work are annotated in the top panel. Bad pixels that were omitted in the pPXF fit are grayed out. The y-axis has units of 10−20erg/s/cm2/Å and is truncated at half the Hα flux.
Current usage metrics show cumulative count of Article Views (full-text article views including HTML views, PDF and ePub downloads, according to the available data) and Abstracts Views on Vision4Press platform.
Data correspond to usage on the plateform after 2015. The current usage metrics is available 48-96 hours after online publication and is updated daily on week days.
Initial download of the metrics may take a while.


