Fig. B.1
Download original image
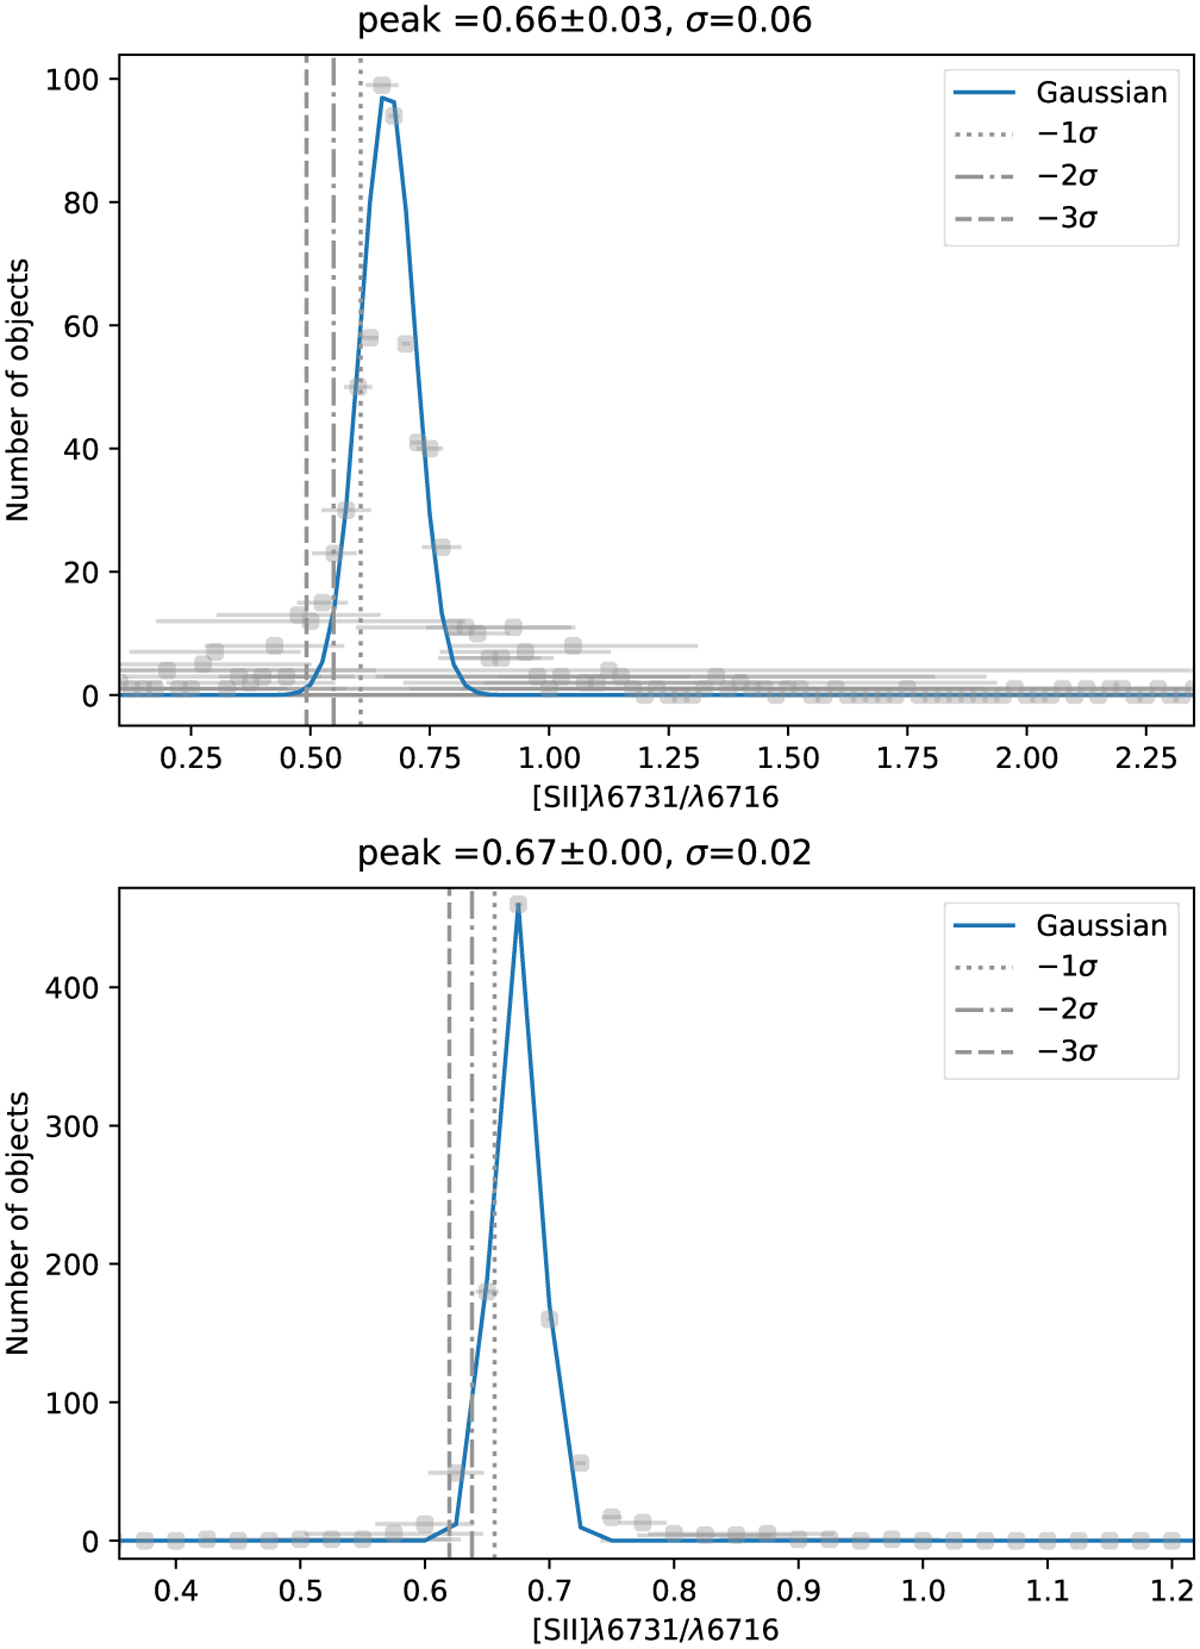
Justification of the [S II]λ6731/16 cutoff. (Top) Histogram of the [S II]λ6731/16 for background-subtracted regions (gray markers with error bars), with the best-fit Gaussian model (solid blue line) and vertical lines indicating the location of −1σ (dotted line), −2σ (dash-dotted), and −3σ (dashed) plotted for convenience. The uncertainties are propagated from the points in each bin. (Bottom) Same as top panel, but for DIG regions.
Current usage metrics show cumulative count of Article Views (full-text article views including HTML views, PDF and ePub downloads, according to the available data) and Abstracts Views on Vision4Press platform.
Data correspond to usage on the plateform after 2015. The current usage metrics is available 48-96 hours after online publication and is updated daily on week days.
Initial download of the metrics may take a while.